Data overload is crushing small and mid-sized businesses, making trend monitoring chaotic and inefficient. Here’s what’s causing the problem and how to fix it:
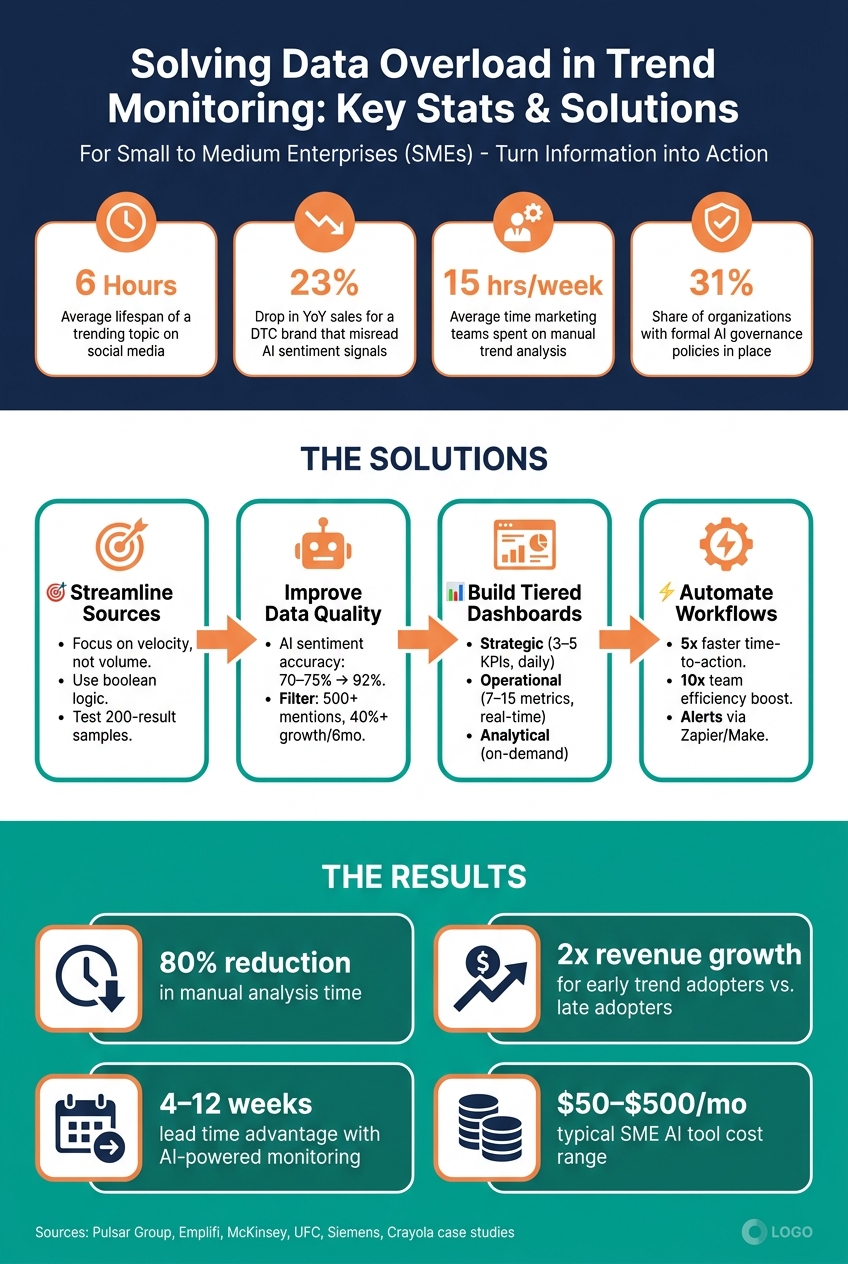
- The Problem: Too much data from too many sources (social media, competitor updates, etc.) overwhelms teams. Trends now rise and fall in just 6 hours, making manual tracking nearly impossible. Businesses waste time sorting irrelevant data, leading to missed opportunities and poor decisions.
- The Impact: Teams lose hours to manual analysis, misinterpret signals (like sarcasm in customer sentiment), and delay responses. For SMEs, this often results in lost revenue and slower growth.
- The Solutions:
- Focus on the most relevant data streams to eliminate noise.
- Centralize data into a single view to reduce inefficiencies.
- Use AI to clean data, detect trends faster, and improve accuracy.
- Build dashboards tailored to specific roles (e.g., executives vs. analysts).
- Automate workflows to save time and act faster.
Key takeaway: Simplify trend monitoring by narrowing your focus, leveraging AI, and automating processes to save time and make better decisions. Businesses that act early on trends see up to 2x revenue growth compared to late adopters.
Data Overload Solutions: Key Metrics & Business Impact for SMEs
The Problem: Data Overload in Real-Time Trend Monitoring
What Causes Data Overload
The issue isn’t a lack of data; it’s the overwhelming amount of it, flowing in from countless sources, at lightning speed, and in multiple formats. Platforms like TikTok, Instagram, YouTube, and Reddit each generate distinct signals. On top of that, you’ve got competitor updates, customer sentiment, and regulatory changes all demanding attention. Keeping up manually? Nearly impossible.
And here’s the kicker: speed makes it worse. The lifespan of a trending topic on social media is now just 6 hours. Trends rise and fall so quickly that traditional methods can’t keep up. The sheer volume of information makes it tough to separate actionable insights from noise. As Peter Staar from IBM Research aptly said:
"The pace of innovation won't slow down in 2026. It's such a crazy time... And it's only accelerating."
This deluge of data doesn’t just complicate analysis - it also delays decisions. The result? Operational slowdowns and missed opportunities.
How Data Overload Affects Business Operations
When data floods in faster than teams can process, it creates serious bottlenecks. With so much noise, distinguishing what matters becomes a challenge, often leading to information paralysis. Instead of acting decisively, teams freeze under the weight of too much data. The fallout? Missed opportunities, delayed decisions, and wasted ad budgets chasing trends that have already fizzled out.
Take this real-world example: A mid-sized U.S. direct-to-consumer (DTC) brand shifted its Black Friday creative strategy just 36 hours before launch. Why? An AI tool flagged "negative sentiment", misinterpreting sarcastic, enthusiastic comments from loyal customers as genuine concern. The brand pivoted to generic, “safe” creative, resulting in a 23% drop in year-over-year sales. This is what happens when speed takes precedence over sound judgment.
Chase Sagum, CEO of Sagum, puts it bluntly:
"Real-time feedback analysis optimizes for reaction, not resonance. And there's a massive difference."
For U.S. small and medium-sized enterprises (SMEs), which often operate with lean teams and tight budgets, this gap between reacting and truly resonating with audiences is more than a marketing issue - it’s a revenue problem. Brands that catch trends early see 2x revenue growth compared to those that act too late. Missing that window, even by a few hours, can mean the difference between leading the conversation and struggling to keep up.
Solution 1: Streamline Your Trend Monitoring Data Sources
The problem with data overload isn’t that you’re looking at the wrong things - it’s that you’re trying to look at everything. Tackling this requires a more focused approach: monitor only the data that supports your key business decisions. This method cuts through the noise and brings clarity to the signals that matter.
Build a Focused Data Strategy
To avoid drowning in irrelevant information, you need to narrow your focus to the most important data streams. Start by asking yourself: What business decision does this data inform? Alex Bryson, Head of Content Marketing at Pulsar Group, puts it succinctly:
"A social listening platform without a strategy is a search bar with a subscription fee."
Keep your monitoring centered on three areas: your core product, related interests, and broader societal issues like affordability or sustainability. Using a "triangular" approach prioritizes emerging signals over sheer data volume.
One key principle to remember is to focus on velocity, not just volume. For example, a topic that doubles in mentions over 48 hours is a stronger indicator of an emerging trend than a high-volume topic with no growth. Volume shows you what’s already big, while velocity highlights what’s becoming big. Acting on these early signals can lead to significant revenue gains.
To cut out irrelevant data, use precise boolean logic - such as exact phrases, exclusion operators, and topic intersections. Before finalizing any monitoring setup, test it by reviewing a two-week sample of around 200 results. If more than 20% of the results are irrelevant, refine your exclusions.
Once you’ve streamlined your data sources, the next step is to centralize them for consistent and efficient analysis.
Consolidate Data into a Single View
Pulling data separately from platforms like Reddit, Instagram, TikTok, and LinkedIn can create what’s known as the "toggle tax" - wasting time and mental energy switching between tools to piece together a complete picture. The fix? Consolidation.
Instead of juggling multiple APIs, use a single aggregator to normalize your data into a unified format - covering content, platform, engagement metrics, and timestamps - before diving into analysis. This approach eliminates fragmentation and streamlines workflows. For example:
- Cheil Chile/Samsung reduced reporting time by 80% and improved their responsiveness to market changes by 30% after consolidating their data.
- The UFC slashed their reporting time by 95% by adopting a unified platform.
"The bottleneck is not data; it is the workflow that turns volume into decisions." - Alex Bryson, Head of Content Marketing, Pulsar Group
Combining data from multiple platforms also strengthens your insights. Research shows that monitoring trends across various sources - like tracking a topic as it moves from Reddit to LinkedIn - provides a more reliable picture of a trend’s stability and reach. If a trend is limited to one platform, treat it as a weak signal until it gains traction elsewhere.
Solution 2: Improve Data Quality and Signal Clarity
Once you've consolidated your data into a unified view, the next step is making sure the data is clean and the signals are clear. Even the most advanced systems can get bogged down with bots, spam, duplicate entries, and AI-generated content. By 2026, this issue has become even more challenging - synthetic posts now blend so well into organic conversations that basic keyword filters often fail to spot them.
Set Automated Data Quality Rules
One effective approach is to implement a preprocessing system that cleans your data before it reaches your analysts. This step involves normalizing content by removing URLs, tags, and special characters. You can also set threshold filters and run deduplication checks with tools like n8n or Make using Merge nodes. These measures help block low-value data and prevent the same trend from being logged multiple times.
A good starting point is to ignore topics with fewer than 500 mentions or less than 40% growth over six months. Here's a quick breakdown of recommended rules:
| Parameter | Recommended Rule | Purpose |
|---|---|---|
| Min Volume | 500+ mentions | Filters out low-impact noise |
| Min Growth | 40% over 6 months | Confirms sustained momentum |
| Confidence Threshold | 0.25 difference | Overrides AI label when slang/emojis conflict |
| Deduplication | Keep non-matches only | Avoids processing the same trend twice |
Once your data is cleaned, AI tools can step in to extract and enhance the most meaningful signals.
Use AI to Filter and Enrich Trend Data
Cleaning the data is only the first hurdle. The next challenge is making sure AI can interpret the cleaned data accurately. Standard sentiment analysis models often stumble on sarcasm and irony, sometimes mistaking a sarcastic complaint for a glowing review. However, newer contextual AI models have improved sentiment accuracy to 92%, a significant leap from the previous 70–75% range.
Natural Language Processing (NLP) clustering takes things further by grouping related content across various phrasings, hashtags, and platforms into unified themes. Instead of wading through hundreds of isolated posts, this approach reveals the bigger picture. For example, in March 2026, Crayola implemented Emplifi's AI-powered social listening tool to replace manual reviews with automated theme detection. Under the guidance of Brittany Mehalick, Social Media Engagement and Trends Manager, this initiative led to:
- 90% faster trend detection
- An 80% increase in processing speed for viral content
- A 100% boost in monitored TikTok engagement
"We're not just reacting anymore. We're listening with purpose using Emplifi. And that's showing up in how we connect, how we plan, and how we build loyalty over time." - Brittany Mehalick, Social Media Engagement and Trends Manager, Crayola
The lesson here? Volume shows you what's already trending, while velocity highlights what's gaining momentum. Focus on AI tools that prioritize emerging narratives based on growth rate, not just raw mention counts. A topic doubling in mentions within 48 hours is a far more compelling signal than one with a higher volume but stagnant growth.
Solution 3: Build Dashboards That Drive Decisions
Once your data streams are organized and enriched, the next challenge is turning those insights into dashboards that truly guide action. Having clean, filtered data is only part of the equation - it’s useless if your team can’t make sense of it. The real issue most businesses face isn’t a lack of dashboards; it’s dashboards that are overloaded with information but lack clarity. When dashboards cram in too many visuals or more than seven competing elements, they overwhelm users and discourage adoption due to the mental strain involved. The goal here is to create dashboards that take raw insights and turn them into clear, actionable decisions.
"A dashboard that shows everything tells you nothing. The best dashboards are ruthlessly focused on the decisions their users need to make." - Boundev Team
Set Up Tiered Dashboards
Instead of creating one dashboard for everyone, tailor dashboards to meet the specific needs of each audience. For instance, a CEO doesn’t need granular details - they need a quick snapshot to decide whether a trend is a threat or an opportunity. Meanwhile, a social media manager benefits from real-time data with enough detail to take immediate action.
A three-tier dashboard structure can effectively serve different user groups:
| Dashboard Type | Primary User | Metric Count | Update Frequency |
|---|---|---|---|
| Strategic | C-Suite / Board | 3–5 KPIs | Daily / Weekly |
| Operational | Managers / Team Leads | 7–15 Metrics | Hourly / Real-time |
| Analytical | Data Analysts | Variable | On-demand |
For executive dashboards, focus on 3–5 high-level KPIs with clear trend indicators. Adding a RED/YELLOW/GREEN alert system makes it easy to interpret status at a glance - no need for mental calculations. Operational dashboards should prioritize critical metrics in the top-left corner, where users naturally focus first. A great example comes from Siemens, which partnered with easy.bi in early 2026 to revamp its dashboard framework for over 200 users. By using a three-level KPI hierarchy with progressive disclosure, Siemens cut task completion time from 2.5 minutes to just 40 seconds, with users identifying the right KPIs in under 10 seconds.
Use AI to Summarize Trends and Surface Insights
Once tiered dashboards are in place, integrating AI can take decision-making to the next level by summarizing trends and highlighting key insights in real time. Modern AI-powered dashboards don’t just display data - they explain it. They can translate sudden spikes or changes into plain-language summaries, detailing what happened, why it matters, and the potential consequences.
"The differentiation has moved to what happens after the initial dashboard is generated: can end users query it in natural language? Does the system proactively surface anomalies?" - Haroen Vermylen, CTO and Founder, Luzmo
Think of this as having a built-in daily briefing. AI tools can pull data from multiple sources overnight and deliver a concise morning summary, flagging unusual patterns and suggesting next steps. This shift turns your team from passive observers into proactive decision-makers - without adding extra hours to their day.
sbb-itb-bec6a7e
Solution 4: Automate Your Trend Monitoring Workflows
Dashboards are great, but they’re only as good as the data feeding into them. Instead of spending time manually pulling reports or hopping between platforms, why not set up systems to handle the grunt work for you? With automation, your team can focus on making decisions rather than collecting data. By pairing streamlined dashboards with automated workflows, you’ll ensure your insights stay fresh and actionable.
Automate Data Collection and Trend Detection
Say goodbye to manual reviews and let AI take the wheel. Modern trend-monitoring tools can pull data from social media platforms like TikTok, Instagram, and X, as well as news outlets, blogs, forums, and even policy updates - all in real-time. Some platforms go even further, scanning over 150 million websites and 30+ social networks simultaneously to spot emerging trends.
Small teams can benefit from focusing on narrative velocity - how quickly a topic spreads - rather than just its total mentions. For example, a story that doubles in mentions within 48 hours signals a stronger trend than a high-volume topic with no growth. Tools like Trends Monster update data hourly, giving you a sharper edge compared to traditional weekly reports.
"Trendtracker helps us connect the dots early and align stakeholders around a shared evidence base... turning trend exploration into an operational foresight capability for SMEs." - Elena Balbekova, Strategic Project Lead
You can also set up threshold-based alerts to notify your team when key metrics like mention volume, sentiment, or narrative velocity hit certain levels. No-code tools like Zapier or Make make it easy to integrate these signals directly into your content pipeline, Slack, or Google Sheets.
Use Curated AI Tools Built for SMEs
High-end monitoring platforms often come with hefty price tags and steep learning curves. For smaller teams, the smarter play is to choose tools designed for operators, not engineers. For instance, Opal offers automated "Daily Pulse" briefings that summarize overnight data into a quick morning update - no need to dig through dashboards.
"I used to spend the first hour of every morning just figuring out where things stood. Now I open Opal and it's already done." - Morganne R., Operator
This approach doesn’t just save time - it makes trend monitoring effortless and proactive. And finding the right tool doesn’t have to be overwhelming. AI for Businesses is a curated directory specifically for SMEs and scale-ups, featuring vetted AI tools tailored to smaller teams. Instead of wading through countless options, you can zero in on tools that match your budget and workflow - no IT expertise required.
Teams that embrace automated monitoring often report game-changing results: a 5x reduction in time to action and up to a 10x boost in overall team efficiency. For lean teams, this isn’t just a minor improvement - it’s a whole new way to leverage trend intelligence effectively.
Governance and Oversight in Trend Monitoring
Automation and AI have made trend monitoring more efficient, but without proper governance, trust and effectiveness can quickly erode. Governance plays a key role in turning raw data into actionable insights by ensuring accountability and oversight.
Set Up Data Governance Policies
A solid governance framework starts with assigning clear ownership for each alert tier and data output. Each alert must have someone responsible for reviewing it and determining the next steps.
"Alerts lacking an assigned owner lead to inaction; this is the most common failure mode in enterprise monitoring programmes." - Dahye Lee, Marketing Research Lead, Pulsar Platform
One effective strategy is to create an escalation ladder. This is a set of rules that ties alert levels to specific actions. For instance:
- Low alerts: Trigger an internal note.
- Medium alerts: Require a moderation review.
- High alerts: Lead to immediate action, such as removing a post.
This approach ensures that raw signals are processed into a clear, actionable workflow.
Governance policies should also include guidelines for data retention. Specify how long trend data will be stored and how it will be used for long-term analysis, like tracking shifts in sentiment over months. With only 31% of organizations currently having formal AI policies in place, even a basic governance plan can give your team a significant advantage.
Once these rules are established, integrating human oversight ensures the system remains accurate and responsive.
Keep Humans in the Loop with AI Processes
AI, while powerful, can miss subtleties like sarcasm or coded language. That's why human oversight is essential to maintain accuracy and capture context. This collaboration between humans and AI is crucial for ensuring insights align with your brand and objectives.
To refine the process, implement a weekly review of false positives. Take a sample of AI-flagged content and classify each item as either a legitimate concern or irrelevant noise. This feedback loop helps fine-tune alert thresholds and prevents unnecessary reactions to isolated incidents. Pair this with a signal ladder, which ranges from minor mentions (Level 1) to significant changes in business metrics (Level 5).
"The monitoring layer is only as trustworthy as the governance around it." - Jordan Mercer, Senior SEO Content Strategist
Streamlining human oversight is key to avoiding delays. Outputs must be explainable, especially for non-technical stakeholders who rely on these insights to act confidently. By combining robust governance with human insight, teams can respond quickly and effectively without getting bogged down in unnecessary bureaucracy.
How to Measure the Success of Your Data Overload Solutions
When dealing with streamlined data and automated workflows, it's essential to track the right metrics to ensure your decisions stay timely and effective.
Key Performance Metrics to Track
To measure the success of your solutions, focus on a handful of core metrics. Tracking too many can lead you right back to the overload you’re trying to avoid. Avoid the temptation to create a "vanity dashboard" and instead zero in on indicators that directly tie to measurable business outcomes.
| Metric | What It Measures | Success Benchmark |
|---|---|---|
| Analyst Hours Saved | Reduction in manual research time | An 80% reduction in manual analysis time compared to early 2026 averages |
| Lead Time to Mainstream | How early trends are identified before they peak | 4–12 weeks ahead of competitors |
| Signal-to-Noise Ratio | Relevance of delivered alerts | 100% of alerts meet a defined goal |
| Synthesis Time | Time to transform raw data into actionable insights | Reduced from hours to under 45 minutes per report |
Among these, lead time stands out as a critical indicator. AI-powered monitoring often provides teams with a 4–12 week advantage over traditional quarterly research cycles. This early detection matters: brands that act on trends ahead of their competitors typically see around twice the revenue growth of late adopters.
"Businesses that recognize shifts in customer behavior early are far more likely to adapt successfully than those that react after trends become obvious." - McKinsey
These metrics form the backbone of a system designed for continuous improvement in trend monitoring.
Continuous Optimization
Once you've identified the right metrics, the next step is ensuring your system stays agile. Trends evolve, and what worked a year ago might miss emerging signals today. Regular evaluation is key.
Start by running a new AI monitoring tool alongside your existing sources for 2–4 weeks before making any changes. This side-by-side comparison helps pinpoint which legacy sources are adding unnecessary noise, so you can confidently phase them out.
Set aside 45 minutes each week to review signals, track your metrics, and test one new experiment. During these sessions, use a clear definition of what qualifies as a trend - such as "a repeated change in behavior, language, or technology across at least three independent sources" - to ensure consistency in your evaluations.
It’s also a good idea to maintain an archive for promising signals that haven’t been acted on yet. This reduces the pressure to respond to every spike while ensuring you don’t lose sight of early clues that may become crucial later.
Conclusion: Better Trend Monitoring for SMEs
The strategies outlined above show how targeted data practices and automated workflows can help businesses cut through the chaos of data overload. The key is shifting from trying to track everything to identifying the specific insights your business truly needs. By narrowing your focus, automating repetitive processes, and creating dashboards that highlight actionable decisions rather than raw data, the noise fades quickly.
This isn't just theory - there's proof to back it up. For instance, marketing teams previously spent an average of 15 hours per week on manual trend analysis before adopting AI tools. With optimized AI solutions, that time can be reduced by up to 80%, allowing teams to spend more time acting on insights rather than searching for them.
Small and medium-sized enterprises (SMEs) have a distinct advantage here. Unlike larger organizations, smaller teams can adapt quickly once a trend or signal is identified. And the best part? Even a modest investment can deliver substantial productivity improvements. Many AI tools tailored for SMEs are available for $50 to $500 per month, and they don’t require a specialized data engineering team. Platforms like AI for Businesses make it even easier by offering a curated selection of tools designed specifically for SMEs. This flexibility and accessibility allow smaller businesses to adopt streamlined, effective approaches with ease.
FAQs
How do I choose the right data sources to monitor?
Begin by pinpointing the specific business questions you want to answer. These questions will serve as a roadmap for selecting the right data.
To get a well-rounded view, combine attitudinal data (like insights from social media posts or product reviews) with behavioral data (such as search trends or e-commerce activity). Aim to incorporate at least four different data types. This approach minimizes bias and ensures a more accurate picture.
Pay close attention to signals that consistently show up across multiple sources. Also, prioritize data that’s already structured and directly ties back to revenue drivers. This way, you’ll ensure the data aligns with your objectives and delivers actionable insights.
How can I tell real trends from noise fast?
To spot real trends fast, pay attention to velocity - how quickly a narrative or metric picks up steam - rather than just the overall volume. True trends tend to show steady growth across multiple platforms and spark meaningful community interaction. Leverage AI tools to group data, monitor momentum, and weed out temporary spikes. Focus on early indicators from upstream sources like niche forums or GitHub, and confirm trends by looking for consistent patterns across various sources.
What’s the easiest way to automate alerts and reporting?
No-code platforms like n8n or Make.com make automating alerts and reporting incredibly straightforward. These tools allow you to link data sources, AI models, and communication channels without needing advanced coding skills. You can create scheduled triggers to automatically gather and process data, extract insights, and deliver the results directly to platforms like Slack or email. This approach removes the hassle of manual monitoring and ensures you receive tailored, actionable reports effortlessly.