Power BI offers three main ways to detect anomalies in dashboards, helping businesses identify unusual patterns in data like sales spikes or traffic drops. Here's a quick breakdown:
- Built-in Anomaly Detection: A simple, one-click tool for spotting outliers in line charts. It uses the SR-CNN algorithm and provides explanations for anomalies. Best for quick insights but limited to specific visuals.
- DAX Statistical Methods: Customizable formulas like Z-scores and standard deviations to detect anomalies across various visuals. Requires intermediate skills but offers flexibility and deeper analysis.
- Azure Anomaly Detector Integration: Advanced, multivariate analysis using dynamic thresholds. Ideal for complex scenarios but involves extra costs, technical setup, and is set to retire in October 2026.
Each method suits different needs, from quick monitoring to detailed analytics. Choose based on your data complexity, technical skills, and budget.
1. Built-in Anomaly Detection
Detection Capabilities
Power BI’s built-in anomaly detection leverages the SR-CNN algorithm, the same technology behind Azure's Anomaly Detector. By enabling this feature through the Analytics pane on a standard line chart, users can analyze time-series data to identify points that fall outside the expected range. The chart visually represents these anomalies with a shaded boundary for the expected range and custom icons marking the outliers. Clicking on an anomaly reveals a concise explanation of the deviation.
This feature became widely available on June 1, 2021. It is specifically designed for standard line charts and does not support visuals with legends, secondary values, or multiple Y-axes. The tool also includes a range of customization options to refine its functionality further.
Customization Options
Power BI provides a variety of settings to tailor anomaly detection and visualization. The sensitivity parameter is a key control, adjustable from 0% to 100%, allowing users to determine how responsive the algorithm is to deviations. A higher sensitivity will flag even minor variations as anomalies, while a lower setting focuses on detecting more pronounced outliers.
Users can also customize the appearance of the anomalies by modifying marker shapes, sizes, and colors, as well as adjusting the transparency and fill style of the expected range area. Additionally, the "Explain by" field enables users to drag specific dimensions - like "Store Location" or "Product Category" - into the analysis. This helps narrow down the root cause of anomalies. For instance, setting sensitivity to 99% can identify precise contributors in aggregate time-series data with high accuracy.
Scalability and Performance
Designed for real-time insights, the anomaly detection tool in Power BI is optimized to deliver quick and efficient analysis. It works seamlessly in both Power BI Desktop and the online service without requiring manual data slicing. When an anomaly is selected, the tool performs real-time analysis across relevant data fields to compute an "explanatory strength" metric.
However, there are some restrictions. The feature is not compatible with DirectQuery on SAP data sources, Power BI Report Server, or live connections to Azure Analysis Services and SQL Server Analysis Services. To enhance performance on large datasets, it’s recommended to limit the dimensions added to the "Explain by" field, rather than scanning the entire data model. Additionally, anomaly detection cannot run alongside Forecast, Min, Max, Average, Median, or Percentile lines.
2. DAX Statistical Methods
Detection Capabilities
DAX provides a framework for rule-based anomaly detection by utilizing calculations like Z-scores and standard deviations to highlight unusual deviations in data. These methods help identify data points that stray significantly from the average and can be applied across various visuals and datasets. DAX supports the detection of three main types of anomalies: point anomalies (isolated spikes), contextual anomalies (abnormalities within specific contexts), and collective anomalies (clusters of unusual data points).
Customization Options
DAX formulas allow users to tailor anomaly detection to fit unique requirements. You can set custom trigger points based on historical data or specific business thresholds. As Sam, Founder of EnterpriseDNA, puts it:
"To do this in Power BI, you will need to combine a number of DAX formula and visualization techniques to showcase what is an abnormal result and why this anomaly may be occurring".
DAX is frequently used to calculate rolling averages or apply seasonal decomposition, which helps smooth out data trends and minimize false positives. Additionally, custom DAX measures can be paired with Smart Narratives to provide automated, natural-language explanations for detected anomalies. These customization options make it possible to handle datasets of varying sizes with precision.
Scalability and Performance
DAX excels in rule-based anomaly detection but achieves optimal results when paired with advanced tools for large-scale analysis. Running within the Power BI engine, DAX is well-suited for moderate computational tasks at the model level. For more complex or high-frequency data scenarios, performance can be enhanced by disabling privacy levels when connecting to external AI services. Unlike built-in anomaly detection features, DAX methods integrate seamlessly with other analytical tools, supporting full drill-down capabilities and maintaining filter context.
Root Cause Analysis
DAX measures work in tandem with Smart Narratives to generate clear, natural-language explanations for outliers. By creating measures that isolate and segment anomalies, you can dig deeper to understand their causes. This approach is especially effective for pinpointing specific factors behind an anomaly, such as identifying whether a sales spike was driven by a particular region, product, or time period.
3. Azure Anomaly Detector Integration
Detection Capabilities
Azure Anomaly Detector offers dynamic thresholding for Power BI, replacing rigid thresholds with flexible bounds based on historical data trends. Tobias Zwingmann, an AI Consultant and author, highlights this advantage:
"The 90-percentile mark is static and does not consider any trends that are happening in the data... Azure Anomaly Detector [calculates] dynamic upper and lower bounds for the expected value."
This service uses advanced pre-trained models to analyze time-series data more effectively than traditional statistical approaches. For example, in December 2022, an airline team integrated Azure Anomaly Detector into their Power BI dashboard to monitor taxi-out times at DFW and LAX airports. This setup flagged anomalies that static thresholds failed to catch. The tool supports both batch detection for historical data and real-time analysis, as well as multivariate detection to identify anomalies across multiple related variables. These capabilities enable more adaptive and precise anomaly detection.
Customization Options
You can adjust the Sensitivity parameter (e.g., 95 or 99) to control how strictly anomalies are detected. The integration also allows for setting data granularity - daily, hourly, or minutely - through JSON configuration to match the time-series frequency. For further customization, users can prepare data, make API calls, and integrate responses into Power BI using Power Query (M), Python, or R scripts. To enable scheduled data refreshes when using Python or R scripts in Power BI Service, installing a Personal Gateway is recommended. Additionally, pre-trained models, saved as pickle files, can be deployed to generate labels without retraining during every dataset refresh.
Scalability and Performance
Azure Anomaly Detector's REST API handles heavy computations, ensuring Power BI dashboards remain responsive, even with large datasets. The service automatically selects the most suitable algorithm from its model gallery based on your time-series characteristics. The free tier allows up to 10 calls per second and 20,000 transactions per month, while the standard tier costs around $0.314 per 1,000 transactions. For smoother API integration, it’s advised to select "Ignore the Privacy Levels" in Power BI settings. However, keep in mind that Azure Anomaly Detector will be retired on October 1, 2026. These optimizations ensure efficient performance and lay the groundwork for deeper analysis.
Root Cause Analysis
Between 2014 and 2019, analysts at the Delaware Department of Education used PyCaret and Power BI to monitor credit card transactions, identifying unusual spending patterns by excluding irrelevant features. Power BI's integration with Azure Anomaly Detector also allows users to focus AI analysis on specific dimensions by dragging fields into the "Explain by" section. This generates natural language explanations for anomalies. Power BI calculates explanatory strength as a ratio of the deviation from the expected value when filtered by a particular dimension. For example, it might identify a specific seller with an explanatory strength of 99%.
sbb-itb-bec6a7e
AI in Power BI: How to Detect Anomalies & Outliers in Line Charts
Advantages and Disadvantages
Power BI Anomaly Detection Methods Comparison: Features, Costs, and Use Cases
Each Power BI anomaly detection method is tailored to specific business needs, balancing factors like complexity, cost, and required expertise. Below, we break down the strengths and limitations of these methods to help you decide which one aligns best with your goals.
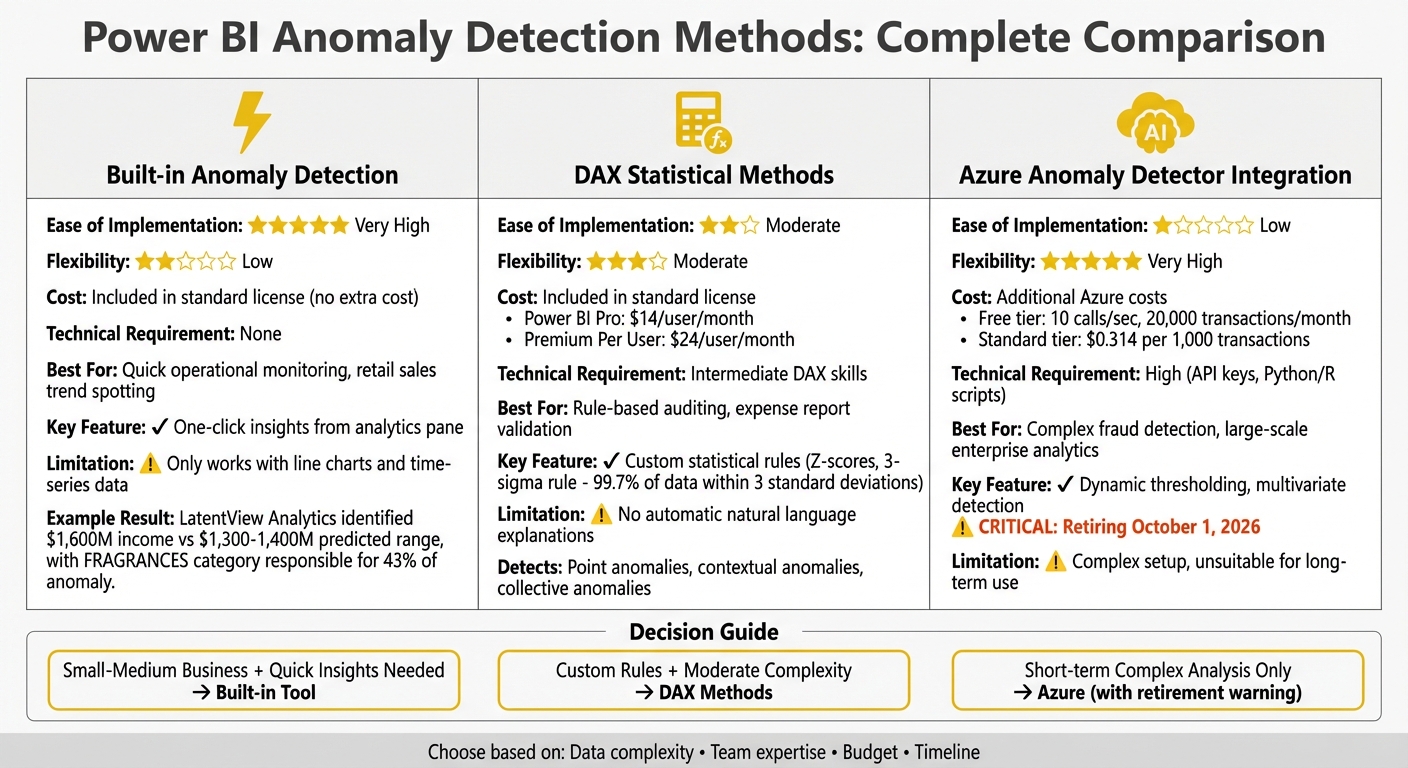
The built-in anomaly detection tool is a quick and straightforward option, offering one-click insights directly from the analytics pane. A great example of this simplicity comes from LatentView Analytics in December 2018. They analyzed market share in the beauty industry and found that total income hit $1,600 million - well above the predicted $1,300 to $1,400 million range. The tool even identified that the "FRAGRANCES" category was responsible for 43% of the anomaly. However, this ease of use has its limits: it only works with line charts and time-series data.
DAX statistical methods offer a middle-ground solution. They allow outlier detection across any visual type and are included with the Power BI Pro license ($14 per user/month) or Premium Per User license ($24 per user/month). Using formulas like Z-scores and the 3-sigma rule, this method assumes about 99.7% of data falls within three standard deviations of the mean. While flexible, it requires intermediate skills and doesn’t provide automatic natural language explanations.
For the most advanced analysis, Azure Anomaly Detector integration stands out with its multivariate detection capabilities. However, it is also the most expensive and complex option. Setting it up involves creating an Azure Cognitive Services account, obtaining API keys, and possibly writing Python or R scripts. Adding to its challenges, Microsoft plans to retire this service on October 1, 2026, making it unsuitable for long-term use in new production environments.
| Method | Ease of Implementation | Flexibility | Cost | Best Business Scenario | Technical Requirement |
|---|---|---|---|---|---|
| Built-in Anomaly Detection | Very High | Low | Included in standard license | Quick operational monitoring and retail sales trend spotting | None |
| DAX Statistical Methods | Moderate | Moderate | Included in standard license | Rule-based auditing like expense report validation | Intermediate |
| Azure Anomaly Detector Integration | Low | Very High | Additional Azure consumption costs | Complex fraud detection and large-scale enterprise analytics | High |
Ultimately, the best choice depends on your business size and technical capabilities. For small to medium-sized businesses, the built-in anomaly detection tool offers great value, as it requires no extra investment beyond the Power BI Pro license and delivers fast, actionable insights. If your organization needs custom statistical rules, DAX methods are a solid choice, avoiding the complexity of external integrations while keeping everything within Power BI. On the other hand, the Azure Anomaly Detector, given its upcoming retirement, is better suited for short-term, highly specialized use cases.
Conclusion
Each anomaly detection method has its own strengths and trade-offs. The best choice depends on your team's expertise, business goals, and the complexity of your data. For quick insights without technical know-how, the built-in tool is a solid option - it delivers results with just a few clicks and doesn’t require advanced skills. On the other hand, DAX statistical methods allow for creating custom rules tailored to specific visuals, offering greater flexibility. Both of these methods are included with no additional licensing costs. Meanwhile, Azure, though advanced, demands higher technical skills and comes with extra costs, such as $0.314 per 1,000 transactions, and is set to be retired soon.
When deciding, consider data volume and the level of customization you need. For straightforward sales trends or operational data, the built-in tool works well right out of the box. If you need more control, like setting statistical thresholds (e.g., anomalies beyond three standard deviations), DAX provides the precision to meet those needs. For more complex, high-frequency, or multivariate analysis, Azure may have been the go-to solution, but with its retirement on the horizon, planning for alternatives is crucial.
Budget is another factor. The built-in and DAX methods are cost-effective, making them attractive for small to medium-sized businesses. Larger enterprises with more resources and dedicated data teams may find the customization potential of DAX worth the extra effort.
Lastly, think about your team’s technical skills. As Microsoft Learn highlights, the built-in feature enables users to "find insights without slicing and dicing the data", making it accessible even for those without programming experience. DAX requires a moderate understanding of formulas, while Azure integration demands advanced technical expertise. Choosing a tool that aligns with your team’s capabilities ensures it can be effectively used and maintained. After all, even the most advanced tools are useless if they sit idle due to a lack of expertise. By selecting the right method for your business context, you’ll be better equipped to uncover actionable insights and make timely decisions.
FAQs
How does Power BI's built-in anomaly detection compare to using DAX formulas?
Power BI's anomaly detection is a no-code solution integrated directly into line charts. It leverages Microsoft’s statistical and machine learning models to automatically identify unusual data points. The feature dynamically adjusts with filters and even provides natural-language explanations to help users understand each anomaly. This approach is perfect for those who want quick, accessible insights without diving into technical details.
For those who need more control, DAX formulas offer a customizable alternative. By using functions like STDEVX.P or AVERAGEX, you can create custom measures to define your own detection logic and thresholds. However, this method requires familiarity with DAX and a solid grasp of the data model, making it better suited for advanced users.
In essence, the built-in tool focuses on simplicity and automation, while DAX-based methods cater to users seeking detailed customization and control.
How does Azure Anomaly Detector improve Power BI, and what challenges should users be aware of?
Azure Anomaly Detector brings AI-powered anomaly detection to Power BI, making it easier to spot unusual patterns and trends in time-series data. Whether you're analyzing data in real-time or through batch processing, this integration allows users to visualize outliers directly on Power BI dashboards. Plus, it provides automated alerts and confidence scores, helping users quickly identify and act on anomalies.
That said, there are a few caveats to keep in mind. To use this feature, you'll need an active Azure subscription. Additionally, its availability is limited - new detector resources can no longer be created after September 20, 2023, and the service itself will be discontinued on October 1, 2026. If your business depends on this tool, it's crucial to plan ahead to avoid disruptions.
What is the most cost-effective way for small businesses to use anomaly detection in Power BI?
The Anomaly Detection feature in Power BI, accessible via the Analytics pane, is an affordable solution tailored for small businesses. It operates seamlessly with a standard Power BI Pro license, so there’s no need to invest in extra tools, services, or custom coding.
This built-in tool is straightforward to configure and allows businesses to spot outliers in their data with ease. For smaller teams aiming to improve their dashboards while keeping costs low, it’s a smart and practical option.