Maintaining data refresh schedules ensures dashboards provide up-to-date information, avoiding outdated insights that can mislead users. Here's how to manage them effectively:
- Set Clear Data Requirements: Define how current each dashboard needs to be based on user needs and business urgency.
- Align with Upstream Data: Schedule refreshes to occur after data sources are updated to prevent delays or inaccuracies.
- Document Policies: Create a detailed runbook outlining ownership, criticality, and refresh expectations to simplify management.
- Monitor and Troubleshoot: Use alerts to track failures, stale data, and runtime changes. Address common issues like credential errors or gateway problems promptly.
- Optimize Schedules: Stagger refresh times to avoid overloading systems, and use incremental refreshes for large datasets to save resources.
- Leverage AI: Implement AI tools to detect anomalies, reduce alert fatigue, and improve efficiency by analyzing refresh patterns.
Power BI Expert Reveals Data Refreshing Tips You Need to Know
sbb-itb-bec6a7e
Understanding Data Freshness Requirements
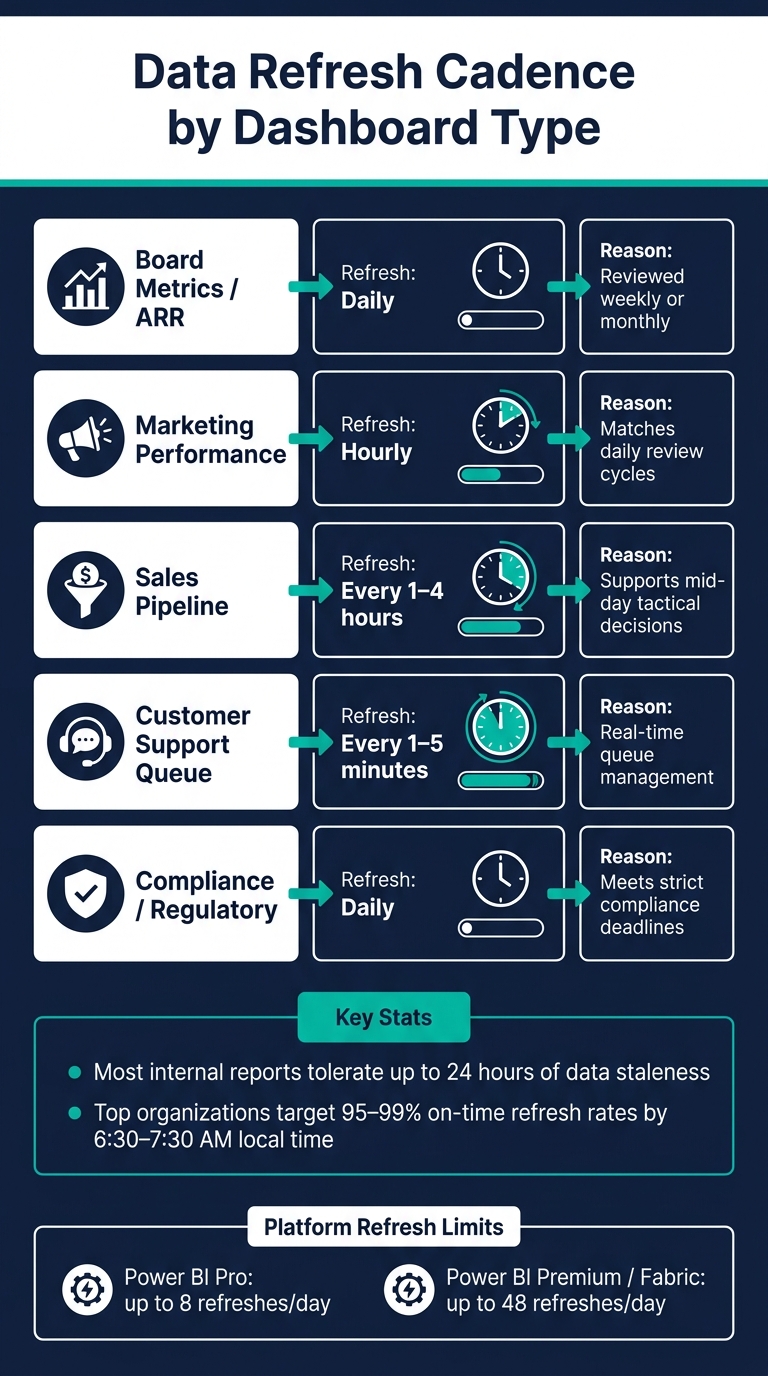
Data Refresh Cadence by Dashboard Type
When setting a refresh schedule, focus on how quickly users need the data - not just how often the data changes.
Here’s a quick guide to align refresh cadence with business urgency:
| Dashboard Type | Recommended Refresh Cadence | Why |
|---|---|---|
| Board Metrics / ARR | Daily | Typically reviewed weekly or monthly |
| Marketing Performance | Hourly | Matches daily review cycles |
| Sales Pipeline | Every 1–4 hours | Helps with mid-day tactical decisions |
| Customer Support Queue | Every 1–5 minutes | Real-time queue management requires near-instant updates |
| Compliance / Regulatory | Daily | Ensures timely compliance with strict deadlines |
Define Business and Technical Requirements
For each dashboard, establish two key criteria: the maximum acceptable data age and the deadline for data readiness. Most internal reports can handle data staleness of up to 24 hours. However, for critical daily reporting, many top-performing organizations aim for data to be ready between 6:30 and 7:30 AM local time, achieving 95% to 99% on-time refresh rates.
Once you’ve determined these requirements, evaluate whether your platform can meet them. For example:
- Power BI Pro allows up to 8 scheduled refreshes per day.
- Power BI Premium and Fabric capacities support up to 48 refreshes daily.
- Keep in mind, Power BI will pause scheduled refreshes after two months of inactivity.
It’s crucial to time refreshes to follow upstream processes like ETL or dbt runs. If a refresh occurs before the source data is updated, users will be working with outdated information.
Document Refresh Policies
After defining your requirements, formalize them in a README.md file or a runbook. A solid refresh policy should outline:
- Owner
- Consumers
- Criticality
- Time zone
- Expected availability window
- Maximum staleness
Standardizing policies prevents inefficiencies, like refreshing fast-moving dashboards based on slow-changing data, which wastes computing resources. It also simplifies troubleshooting. Include a visible Last Refreshed timestamp and allow for a short grace period before triggering alerts.
Configuring and Adjusting Refresh Schedules
To set up and fine-tune refresh schedules, rely on the documented owner, time zone, and freshness targets to ensure each model aligns with your established policy.
Managing Schedules in Power BI and Tableau

In Power BI, head to your workspace, open the Semantic Model settings, and expand the Refresh section. Toggle Scheduled refresh to On, set the frequency, select the appropriate time zone, and specify time slots. Don't forget to configure Failure Notifications so that alerts are sent to the model owner or specific email addresses if a refresh fails. Make sure each time slot matches the availability window outlined in your refresh policy.
Before scheduling, double-check that gateways and credentials are up to date. For on-premises data sources like SQL Server or Oracle, you'll need an On-premises data gateway, while cloud-based sources like Azure SQL or SharePoint can connect directly.
For larger models, start by reducing the load and then plan your refresh timing carefully. Use Incremental Refresh with parameters like RangeStart and RangeEnd to limit refreshes to only the updated data. If View Native Query is grayed out, it means query folding is broken, which could pull more data than necessary. Keep in mind that Power BI typically begins a scheduled refresh within 15 minutes, though heavy capacity usage might delay it by up to an hour. Plan your schedule accordingly, especially if dashboards need to be ready by a specific time.
In Tableau, you can manage refresh schedules through Tableau Cloud or Tableau Server. On Tableau Cloud, open the data source, click Edit Connection, and set a schedule under Scheduled Refreshes. For Tableau Server, administrators configure schedules in the server settings, and publishers assign schedules when publishing data sources. If you're working with on-premises data, ensure the Tableau Bridge client is running and connected. As with Power BI, schedule refreshes to run after upstream ETL or pipeline jobs are completed, and verify credentials to avoid silent failures.
Staggered and Layered Scheduling
Once your models are configured, avoid running all refreshes at the same time. Simultaneous refreshes can overload capacity, leading to delays. Instead, stagger start times by 15- to 30-minute intervals. Use the Refresh Summary page in the Power BI Admin portal to identify 30-minute windows where too many refreshes overlap. To space them out effectively, rely on the 95th-percentile runtime rather than the average to prevent overlapping refreshes from interfering with each other.
For even better control, consider layered scheduling, which chains refreshes based on their dependencies. Ensure upstream datasets finish before triggering downstream dashboards. Tools like Fabric Data Pipelines can help sequence multiple semantic models, so each one waits for its predecessor to complete. If you're using external orchestration tools like Azure Data Factory, you can implement a polling loop against the Power BI REST API to confirm a refresh is complete before moving on to the next task.
Monitoring and Troubleshooting Refresh Health
After scheduling refreshes, it's essential to keep an eye on failures, stale data, and runtime changes to ensure everything runs smoothly.
Set Up Monitoring and Alerts
Once you've established refresh schedules, focus on three key signals: failures, freshness, and duration. For smaller teams, Power BI's failure notifications provide simple email alerts. If you need broader coverage, Power Automate is a great next step. Its "When a dataset refresh fails" trigger allows you to monitor multiple workspaces and send alerts to platforms like Microsoft Teams or Slack.
For larger, enterprise setups with Azure infrastructure, combining the Power BI REST API with Azure Monitor offers advanced control. This setup lets you track specific error codes and capacity-level events. At the gateway level, monitor service status, P90 query duration, concurrent queries, and memory usage.
Don't just track failures - pay attention to freshness, row-count changes, and runtime drift. For example, implement a watermark check that flags datasets if their latest transaction date is older than the expected refresh window. Also, watch for refresh schedules that gradually take longer; a task that used to take 15 minutes but now takes 75 minutes could signal a hidden issue, even without generating an error. Automated monitoring can significantly reduce detection times - from 2–4 hours to under 15 minutes.
When alerts trigger, use the error details to guide your troubleshooting process.
Troubleshooting Common Issues
Most refresh failures fall into a few predictable categories. For credential-related errors, re-authenticate through Data source credentials.
If you encounter gateway errors like DM_GWPipeline_Client_GatewayUnreachable, check the host, network, gateway version, and its Online status. Keep in mind that Microsoft supports only the last six versions of the on-premises data gateway.
Two automatic behaviors in Power BI are worth noting:
- Refresh schedules are disabled after four consecutive failures.
- Refreshes pause after two months of inactivity.
To re-enable a disabled or paused schedule, resolve the issue first, then manually toggle Configure a refresh schedule back to On.
Maintaining an incident response playbook can be a huge time-saver. For example, a document mapping errors like AADSTS50126 to step-by-step solutions allows team members to resolve issues quickly without escalating.
Improving Refresh Performance
Analyzing runtime trends and timeout patterns can help you optimize your refresh schedule. For large models hitting timeout limits (2 hours for shared capacity and 5 hours for Premium), switching to incremental refresh can make a big difference. By updating only new or changed rows, you can reduce runtime and avoid timeouts, sometimes cutting compute costs by up to 90% compared to full rebuilds.
It’s also wise to audit refresh frequency against actual dashboard usage. High refresh rates for dashboards with minimal traffic waste resources and can inflate costs unnecessarily. Running heavy refreshes during off-peak hours can further minimize contention and throttling.
Using AI to Manage and Improve Refresh Schedules
AI goes beyond basic alerts by recognizing patterns and flagging anomalies faster than traditional methods. As refresh volumes increase, static schedules and simple alerts often fall short. AI steps in to learn typical update behaviors, helping to identify unusual patterns, set thresholds, and even detect stale-but-successful refreshes. It can also route alerts directly to the right team, streamlining the process.
Instead of relying on guesswork to determine how often a table should refresh, AI tools analyze historical update logs to identify regular update patterns. For instance, if a table consistently updates at 6:00 AM on weekdays, AI can suggest appropriate freshness thresholds automatically, saving time and effort.
While traditional schedulers confirm that a job ran, AI takes it a step further by verifying whether fresh data actually arrived. This capability is crucial because data teams can spend anywhere from 30 to 60 minutes tracking down the root cause of a single staleness issue in a pipeline.
AI also helps reduce alert fatigue by suppressing unnecessary notifications during planned maintenance windows. It ensures that refresh failure alerts are sent directly to the team responsible for the pipeline, rather than spamming a general channel. For small and medium-sized enterprises (SMEs), a practical starting point is to focus on 5 to 10 critical tables. Once the system establishes baseline patterns, it can be scaled to cover more data assets.
Conclusion
To keep your data fresh and reliable, focus on setting clear freshness SLAs, aligning refresh schedules with actual usage, and actively monitoring data freshness. Don’t forget to regularly update credentials, gateways, and alerts - these small steps can save you from unnecessary reactive work and make it easier to identify stale dashboards.
The main takeaway? Refresh your data only as often as your business truly needs. Defaulting to constant high-frequency refreshes can waste resources and create unnecessary noise.
If your team leverages AI, you can start with the same refresh signals you already monitor manually. AI tools can help by spotting patterns, identifying stale data, and sending alerts to the right people - all without requiring complex custom setups.
The ultimate goal isn’t about having real-time data everywhere. It’s about delivering the right data, at the right time, to support smarter decisions.
FAQs
How do I choose the right refresh frequency?
Choosing the right refresh frequency depends on how often your data changes and how quickly decisions need to be made. For operational dashboards, which monitor fast-moving metrics, updates might be needed every 1–5 minutes or even in real-time. On the other hand, strategic dashboards, which focus on long-term trends, can usually be refreshed daily or weekly.
When deciding, think about a few key factors:
- Data volatility: How frequently does your data change? Highly dynamic data often requires more frequent updates.
- Decision-making cycles: How quickly do you need the insights to act on them? Faster decisions may demand quicker refresh rates.
- Infrastructure capacity: Ensure your systems can handle the update frequency without compromising performance or driving up costs unnecessarily.
Striking the right balance between timely updates and system efficiency is crucial to making the most of your dashboards.
What should I do if a refresh keeps failing?
If a refresh doesn't go through, start by checking the error details using monitoring tools such as Tableau Server's task views or Power BI's refresh history. Typical problems might involve credential issues, schema updates, network disruptions, or hitting resource limits.
To resolve the issue, address the underlying cause: update any outdated credentials, confirm the availability of data sources, or allocate more resources if needed. For Power BI users, make sure to re-enable the refresh schedule if it was turned off after multiple failures. Setting up failure notifications can also help you stay on top of any future issues.
When should I use incremental refresh?
When working with large datasets - especially those that are primarily append-only or frequently updated, like transactions or logs - incremental refresh can be a game-changer. Instead of reloading the entire dataset, it focuses on updating only the most recent data. This approach offers several advantages:
- Faster Refresh Times: By processing only new or updated records, refreshes are completed much quicker.
- Reduced Resource Usage: Minimizing the amount of data processed reduces strain on your system.
- Efficient Data Management: If your data source supports filtering by date or key, you can easily manage both recent and historical data without unnecessary overhead.
This method is particularly useful for keeping your data pipeline efficient while handling large-scale, dynamic datasets.