Need to monitor your systems across multiple platforms? These seven AI-powered tools simplify the process by consolidating data from cloud services, apps, and infrastructure into a single dashboard. Whether you're tracking website performance, mobile apps, or machine learning models, these tools automate problem detection, reduce manual effort, and help you stay ahead of issues.
Key Tools:
- Datadog: Centralizes monitoring for 600+ technologies like AWS, Azure, and Kubernetes. Features predictive analytics and anomaly detection.
- Dynatrace: Offers full-stack monitoring with AI-driven insights and automatic baselining for hybrid and cloud-native environments.
- Grafana Labs: Open-source solution with customizable dashboards and ML-powered anomaly detection. Flexible for SMEs with free and paid options.
- LogicMonitor: SaaS-based tool for hybrid environments, featuring automated discovery and intelligent alerting.
- Monte Carlo: Focuses on data reliability, monitoring pipelines and cloud data warehouses like Snowflake and BigQuery.
- Arize AI: Tracks machine learning model performance, detecting data drift and accuracy issues.
- WhyLabs: Monitors both data pipelines and machine learning workflows, offering seamless integration with tools like SageMaker and Kafka.
These tools streamline monitoring, automate alerts, and help you manage performance efficiently across platforms. Below, we dive into their features, integrations, and pricing to help you choose the best fit for your needs.
AI and LLM Observability with Dynatrace
1. Datadog
Datadog brings together infrastructure, applications, and logs into a single, cohesive view, making cross-platform management much easier. Its all-in-one dashboard removes the hassle of juggling multiple monitoring tools, providing a centralized solution.
Supported Platforms and Integrations
Datadog works seamlessly with over 600 technologies, including AWS, Microsoft Azure, Google Cloud Platform, Kubernetes, and Docker. It also monitors web and mobile apps, databases, and serverless functions with minimal setup, ensuring smooth and efficient performance tracking across various platforms.
2. Dynatrace
Dynatrace offers monitoring tools powered by AI, providing seamless support across multiple platforms. It combines real-time insights with integrated analytics to help users understand and optimize their systems effectively. For more information on supported environments, integrations, scalability, and reliability, refer to the official documentation. With its advanced analytics, Dynatrace stands out as a solid option among modern monitoring solutions.
3. Grafana Labs
Grafana Labs provides an open-source observability suite designed to bring together metrics, logs, and traces from a wide range of sources. Like other tools in this space, Grafana simplifies monitoring by consolidating data from various platforms into a single, user-friendly dashboard. For small and medium-sized enterprises (SMEs) managing systems like AWS, Azure, Google Cloud, Kubernetes clusters, and multiple SaaS applications, Grafana offers real-time insights into everything from API latency to database health - all displayed through flexible and visually engaging dashboards.
Supported Platforms and Integrations
One of Grafana's standout features is its extensive integration ecosystem. It connects seamlessly with time-series databases such as Prometheus and InfluxDB, major cloud providers (AWS, Azure, GCP), Kubernetes environments, SQL and NoSQL databases, and popular tools for application performance monitoring (APM) and log management. For example, a U.S.-based SaaS company can stream AWS CloudWatch metrics, Kubernetes data via Prometheus, and application logs into Grafana. From there, they can create a unified dashboard showing API response times across regions, pod health within their Kubernetes clusters, and error rates - all in one view.
Grafana also supports thousands of plugins and integrations, allowing SMEs to start with pre-built dashboards tailored to common tech stacks and then customize them as their needs evolve.
AI Capabilities
Grafana's AI features take observability to the next level. The platform includes AI-powered anomaly detection, which learns typical behavior patterns across your metrics and flags deviations in real time. Paired with advanced alerting rules and service-level objective (SLO) tracking, these tools help teams identify issues early while reducing unnecessary alerts. Additionally, Grafana offers GPT-powered Ops assistants, which speed up root-cause analysis by helping engineers diagnose cross-platform incidents without manually piecing together data from different systems.
These AI-driven tools are especially valuable for SMEs that lack dedicated site reliability engineers. They enable proactive monitoring of infrastructure, applications, and even AI workloads, providing actionable alerts without requiring deep expertise in every monitored system.
Usability for SMEs
Grafana makes it easy for smaller teams to get started. Its dashboard editor, visual query builder, and library of templates simplify the setup process. Teams can begin with ready-made dashboards for services like Kubernetes, cloud platforms, and databases, then adjust them as their requirements grow. The intuitive interface prioritizes visualization and correlation, making it accessible even for team members who aren't data engineers or site reliability experts. Meanwhile, role-based access controls allow technical leads to manage complex views while keeping things straightforward for support and business teams.
Scalability and Reliability
Grafana is built to grow alongside your business. Its unified monitoring capabilities cover infrastructure, applications, logs, traces, real user monitoring, and synthetic testing - all within the same platform. Whether you're tracking a handful of services or managing a multi-region setup, Grafana scales to meet your needs.
The platform supports both open-source self-hosted deployments and managed cloud services, offering flexibility for businesses to start small and expand as data volumes increase. Complementary tools like Mimir, Loki, and Tempo handle high-throughput data, long-term storage, and multi-tenant workspaces, ensuring that Grafana can adapt to more complex monitoring demands without requiring a complete platform migration.
Security and Compliance
Grafana includes robust security features tailored for business use. These include single sign-on (SSO/SAML), granular role-based access control, and audit logs, which help SMEs manage access to sensitive dashboards and data. Grafana Cloud environments also emphasize security with network isolation, encryption (both in transit and at rest), and integration with existing security tools, supporting compliance with standards like SOC 2 and internal security policies.
These features allow teams to collaborate effectively while maintaining strict access boundaries, ensuring that monitoring data remains secure across technical and non-technical roles.
Pricing Orientation
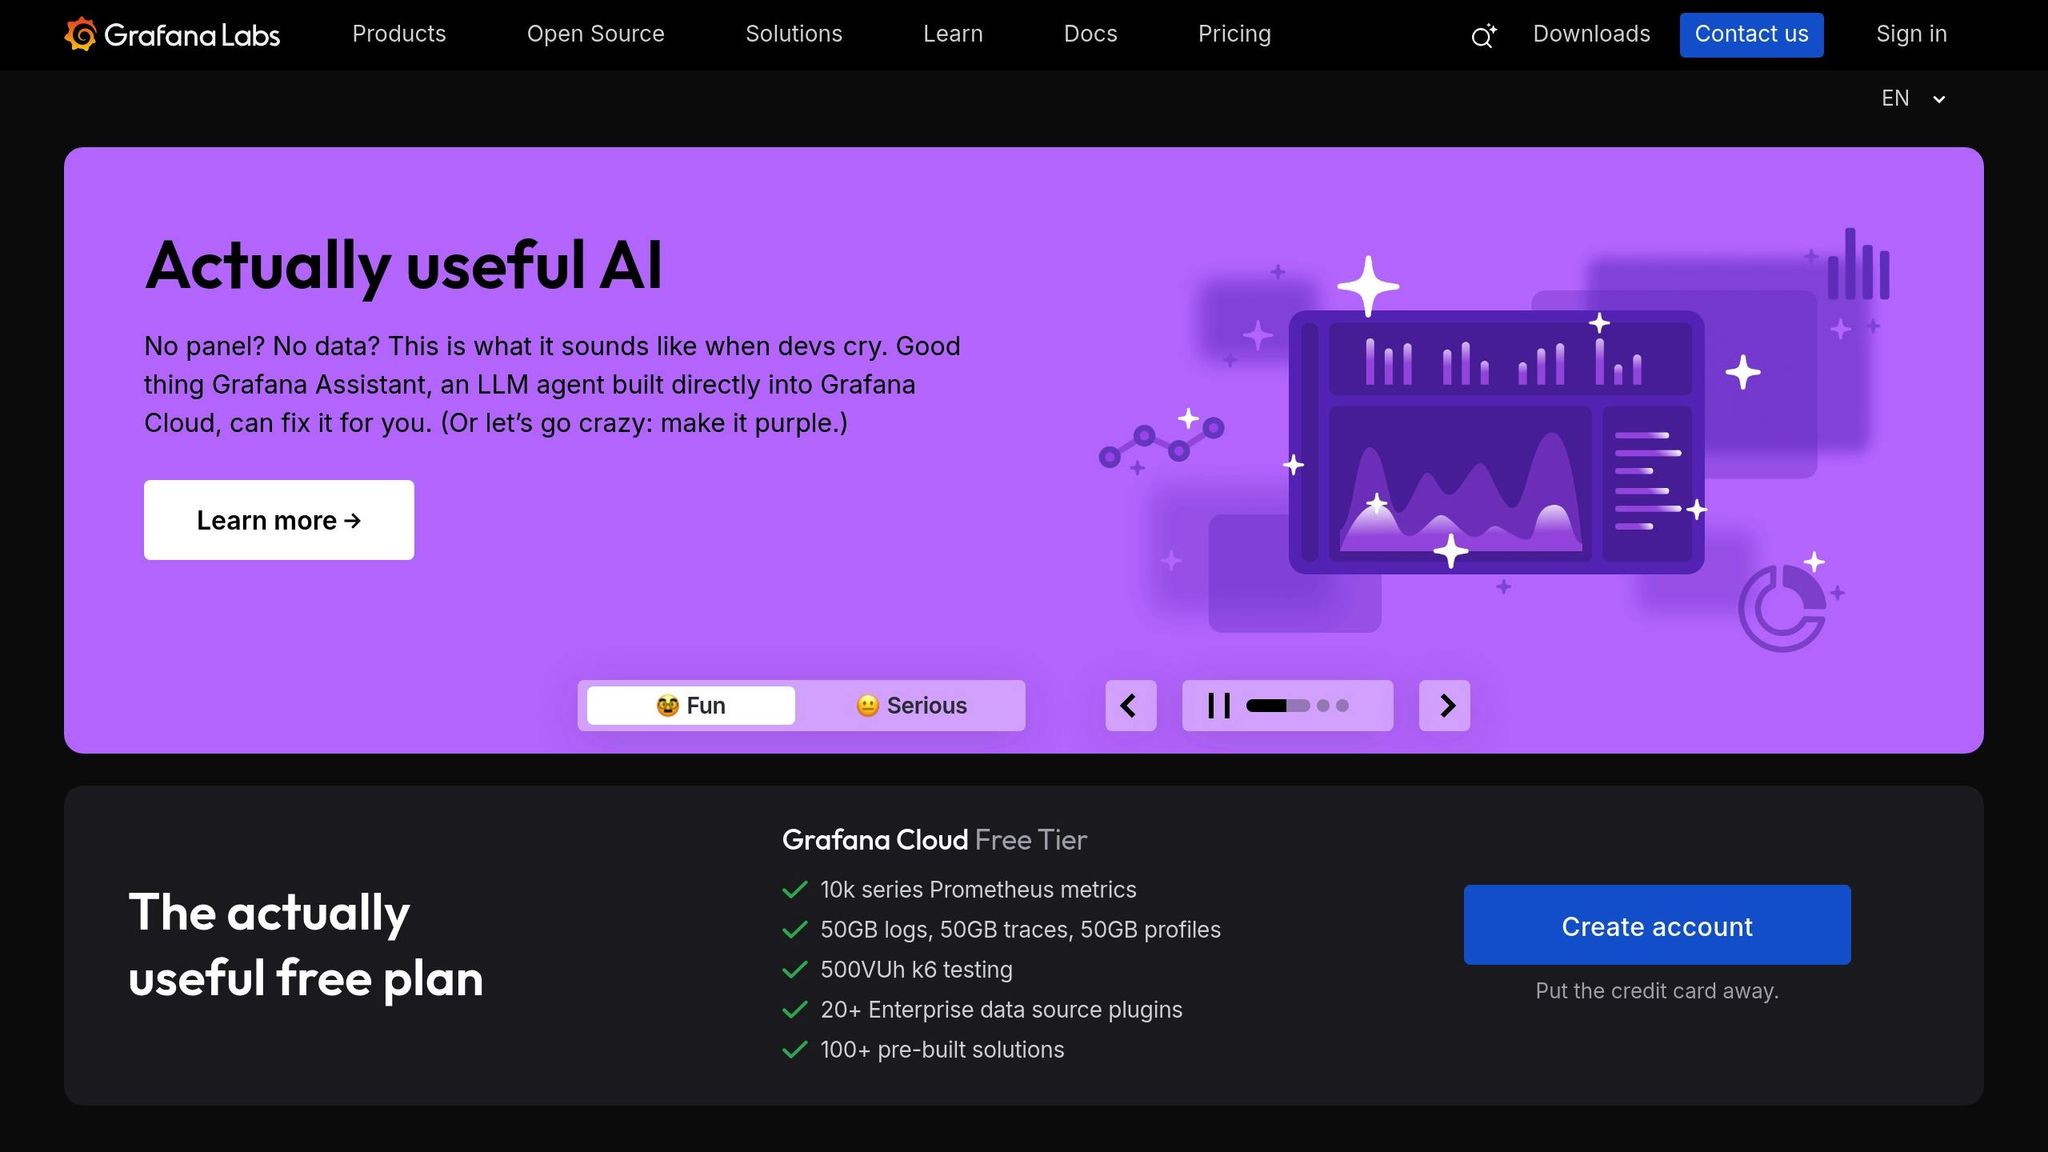
Grafana Labs offers a free open-source edition for self-hosting, which eliminates licensing costs but requires internal resources for setup and maintenance. For teams seeking a simpler option, Grafana Cloud operates on a tiered SaaS model, starting with a free tier and scaling up based on data volume, users, and features. This usage-based pricing, billed in USD, helps U.S. SMEs manage costs predictably while expanding their monitoring capabilities over time.
Whether opting for a self-managed or cloud-hosted solution, businesses can choose a deployment model that aligns with their budget and operational needs. Starting with the free tier or open-source version allows teams to test Grafana's capabilities before committing to a paid plan.
SMEs can further enhance Grafana's functionality by integrating AI tools from AI for Businesses, a directory of monitoring solutions tailored for growing companies. By combining these tools with Grafana dashboards, teams can create a smarter, more comprehensive monitoring stack.
Experts often advise SMEs to begin by centralizing a few key metrics - such as latency, error rates, and resource usage - into a "golden signals" dashboard. Once basic visibility is established, teams can add logs, traces, and SLO-based alerting. Consistent tagging (e.g., by service, environment, or region) and regular dashboard reviews with both technical and business stakeholders ensure Grafana stays aligned with operational goals and incident response workflows.
4. LogicMonitor
LogicMonitor is a SaaS-based monitoring solution that brings together automated discovery, comprehensive visibility, and AI-driven insights to support hybrid environments. It's tailored for small to medium-sized enterprises (SMEs) managing everything from on-premises data centers to public clouds and containerized applications. The platform automatically identifies and maps your entire infrastructure - covering network devices, servers, cloud services, and applications - requiring minimal setup. Plus, its extensive integration capabilities make cross-platform monitoring easier than ever.
Supported Platforms and Integrations
One of LogicMonitor’s standout features is its wide platform support and ready-to-use integrations. It works seamlessly with major cloud services like AWS, Azure, and Google Cloud, as well as virtualization platforms such as VMware and Hyper-V. It also supports container orchestration systems like Kubernetes and Docker, along with databases (e.g., MySQL, PostgreSQL, MongoDB, SQL Server), network equipment (including Cisco, Juniper, and Palo Alto), and business tools like Salesforce, Office 365, and ServiceNow. This allows SMEs to monitor everything - from local servers to cloud resources - within a single interface.
The platform offers both agentless and agent-based monitoring to fit different needs. You can monitor network devices and cloud services without installing software, while lightweight collectors provide in-depth performance data for servers and applications. LogicMonitor also integrates with popular DevOps tools like Slack, PagerDuty, Jira, and ServiceNow. For instance, if CPU usage spikes on a production server, the system can automatically create a ServiceNow ticket and alert the on-call engineer via PagerDuty - no manual steps required.
AI Capabilities
LogicMonitor leverages AI-powered anomaly detection and predictive tools to help SMEs address performance issues before they escalate. Its machine learning models establish dynamic baselines, identifying unusual activity and reducing the noise of false alarms that often come with static thresholds.
The platform’s AIOps features are designed to streamline troubleshooting by correlating events across your infrastructure. For example, if a network switch fails, LogicMonitor groups related alerts and identifies the root cause, helping teams focus on resolving the actual issue rather than sifting through a flood of disconnected alerts.
Additionally, LogicMonitor includes capacity planning tools powered by AI. These tools analyze historical performance data to predict when resources like storage, memory, or bandwidth will hit their limits. This helps teams prepare for growth or seasonal spikes in demand, ensuring they can scale their infrastructure in advance.
Usability for SMEs
LogicMonitor is designed to be easy to deploy and maintain. Its automated discovery feature scans your environment and begins monitoring devices within minutes. Pre-configured dashboards and alert rules provide actionable insights right out of the box, eliminating the need for lengthy setup processes. The user-friendly web interface organizes data by service, location, or business function, making it accessible to both IT teams and non-technical stakeholders.
The platform also offers customizable dashboards and reporting tools to cater to different audiences. IT teams can dive into detailed metrics, while executives can focus on high-level overviews like service availability and response times. For organizations managing multiple departments or business units, LogicMonitor’s multi-tenancy support ensures data segmentation while keeping everything under centralized management.
Scalability and Reliability
Built on a cloud-native architecture, LogicMonitor scales effortlessly as your organization grows. Whether you’re monitoring 50 devices or several thousand, the platform manages data collection, storage, and analysis without requiring additional infrastructure planning. This flexibility is particularly useful for SMEs dealing with rapid growth or fluctuating traffic.
LogicMonitor also ensures reliable performance with its distributed SaaS design. Redundancy is built into every layer - data collection, processing, and storage. Collectors can even be deployed across multiple locations for geographic redundancy, ensuring continuous monitoring even during network disruptions. With robust data retention, the platform supports consistent trend analysis and dependable operations.
sbb-itb-bec6a7e
5. Monte Carlo
Monte Carlo approaches cross-platform monitoring with a distinct focus: ensuring data reliability rather than concentrating solely on infrastructure or application performance. While many tools monitor servers and networks, Monte Carlo zeroes in on data pipelines, warehouses, and analytics workflows - the backbone of business intelligence (BI) systems. For small and medium-sized enterprises (SMEs) that rely heavily on cloud data warehouses, ETL processes, and BI dashboards, Monte Carlo helps prevent data issues that could disrupt critical decision-making.
Supported Platforms and Integrations
Monte Carlo seamlessly integrates with popular cloud data warehouses like Snowflake, BigQuery, Redshift, and Databricks, as well as ETL/ELT tools such as Fivetran, dbt, and Airflow. It also connects with BI platforms like Looker, Tableau, and Power BI. This broad compatibility allows a U.S.-based e-commerce SME, for instance, to monitor schema changes, detect load failures, and identify data quality issues - all from a single dashboard. Automated lineage visualizations further enhance usability by mapping the flow of data from its source, through transformations, to final dashboards. This makes it easier for teams to trace and resolve issues affecting reports or machine learning (ML) models.
AI Capabilities
Monte Carlo leverages machine learning to monitor key data metrics, including volume, freshness, schema structure, and distribution patterns. The platform learns what "normal" looks like for each dataset and flags significant deviations. For example, if a customer activity table typically receives 10,000 to 12,000 new rows daily, the system will alert you if only 500 rows are recorded - or if there’s an unexpected jump to 50,000 rows. This adaptive thresholding reduces unnecessary alerts while ensuring real issues are caught. Features like intelligent incident grouping and root-cause analysis further streamline the troubleshooting process, helping teams focus on the most pressing problems. Some users report resolving data incidents up to 90% faster thanks to these capabilities.
Usability for SMEs
Monte Carlo is designed to integrate smoothly with existing data platforms, offering quick onboarding without the need for manual coding. Its user-friendly interface presents incidents in clear, business-relevant views, such as "impacted dashboards", "affected tables", and "likely root cause." This makes it accessible even to non-technical team members like analytics leads. For a small U.S. data team, this could mean reducing the time to meaningful alerts from weeks to just days. Additionally, Monte Carlo works with operational tools like Slack, PagerDuty, and Jira, ensuring that issues are escalated and resolved promptly. For example, a retail SME might use Monte Carlo to catch schema changes or late-arriving data that could otherwise impact recommendation models and hurt conversion rates.
Scalability and Reliability
Monte Carlo is built to handle large-scale data operations, effortlessly monitoring everything from a few dozen tables to thousands, while managing trillions of rows. Adding new data sources is straightforward, requiring only simple connector configurations. This scalability ensures that as your organization grows, your monitoring workflows remain efficient and effective.
Security and Compliance
Monte Carlo prioritizes security by ingesting only metadata and aggregate statistics, not raw data, which helps maintain privacy and meet regulatory requirements. The platform includes enterprise-grade security features like role-based access, SSO/SAML integration, and compatibility with existing cloud security models. Its SOC 2 Type II certification and strong encryption practices further underscore its commitment to safeguarding sensitive information. For U.S. SMEs, this focus on security helps meet compliance standards like SOC 2 and GDPR while aligning with internal policies.
Pricing Orientation
Monte Carlo offers custom pricing based on the number of monitored data assets and connectors. To determine its value, SMEs can request a demo and evaluate how the platform might help prevent costly data incidents. For many, the real value lies in avoiding issues like broken revenue dashboards or mispriced inventory models, which can lead to significant financial losses. Smaller organizations should weigh the platform’s cost against the impact of past data problems and the importance of protecting critical datasets and AI workloads. Resources like AI for Businesses can help SMEs explore tools that fit their budget and tech stack.
Many SMEs adopt Monte Carlo to ensure data and model reliability while using other tools to monitor infrastructure and application performance. In a layered observability setup, for example, a production issue affecting an AI feature might first appear as a latency spike in an application performance monitoring (APM) tool, while Monte Carlo identifies whether a data problem - like missing features or delayed ETL processes - is the root cause.
6. Arize AI

Arize AI is designed to keep an eye on machine learning models in production. Rather than sticking to conventional infrastructure metrics, it zeroes in on critical aspects like model accuracy and data drift. This approach helps teams catch potential problems early. With user-friendly dashboards and alerts, Arize AI makes it easier to understand performance without needing deep technical know-how. It works alongside broader tools to ensure AI-powered applications stay reliable and effective.
7. WhyLabs
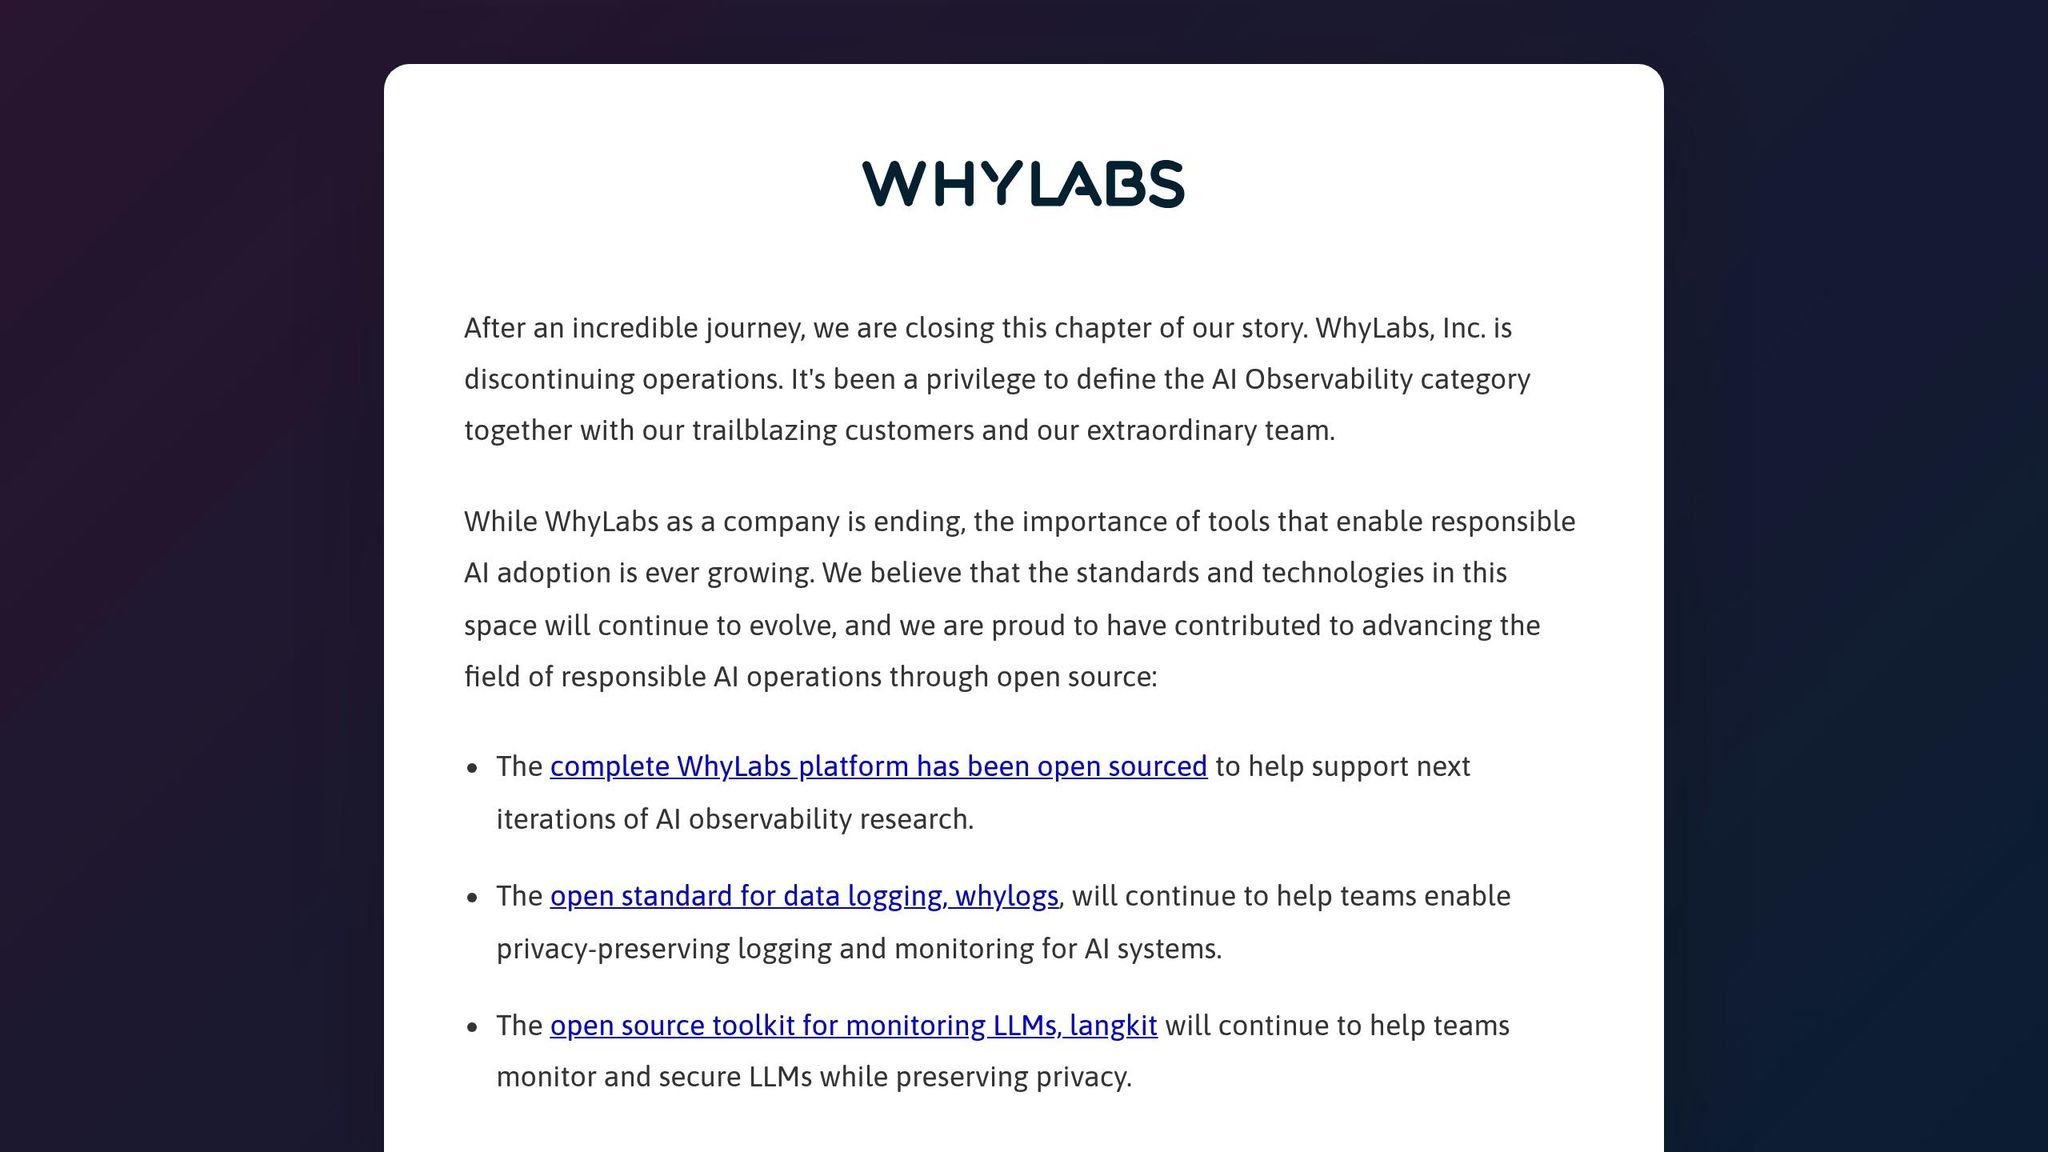
WhyLabs stands out by combining oversight of data pipeline integrity with monitoring of machine learning (ML) workflows, offering a unified solution for cross-platform tracking. It provides teams with a clear view of both data pipelines and ML workflows, ensuring continuous monitoring across platforms.
Supported Platforms and Integrations
WhyLabs works effortlessly in both cloud-based and on-premises environments. It integrates with widely-used data processing tools like Apache Spark and Apache Kafka, alongside ML platforms such as MLflow and Amazon SageMaker. This flexibility makes it easy to incorporate WhyLabs into your current workflows without requiring a significant overhaul.
Scalability and Reliability
Built to handle the needs of growing organizations, WhyLabs features an architecture that adapts to increasing monitoring requirements. Its independent SaaS model ensures consistent performance, even during periods of system variability, making it a dependable choice for businesses scaling their operations.
Comparison Table
Selecting the right cross-platform monitoring tool comes down to understanding how each option fits your specific needs. The tools covered here each bring their own strengths to the table, tailored to different use cases and priorities.
The table below highlights the key differences among these tools, focusing on supported platforms, AI features, deployment options, and benefits for small and medium enterprises (SMEs). Use this as a quick reference to compare their offerings and identify the best fit for your requirements.
| Tool | Supported Platforms | AI Features | Deployment Options | SME Benefits |
|---|---|---|---|---|
| Datadog | Cloud (AWS, Azure, Google Cloud), on-premises, hybrid, containers (Kubernetes, Docker) | Anomaly detection, predictive analytics, automated root cause analysis | SaaS, agent-based monitoring | Unified dashboard for monitoring infrastructure and apps, 600+ integrations, pay-as-you-go pricing starting at $15 per host/month |
| Dynatrace | Cloud-native, hybrid, mainframes, containers, serverless | AI observability (Davis AI), automatic baselining, predictive problem detection | SaaS, managed cloud, on-premises | Full-stack visibility, automatic dependency mapping, reduces MTTR by up to 90%, free trial available |
| Grafana Labs | Multi-cloud, on-premises, Kubernetes, Prometheus, InfluxDB, Elasticsearch | ML-based alerting, pattern recognition, anomaly detection plugins | Open-source (self-hosted), Grafana Cloud (managed SaaS) | Budget-friendly open-source option, customizable dashboards, free tier on Grafana Cloud with 10,000 series metrics |
| LogicMonitor | Cloud infrastructure, SaaS apps, network devices, servers, storage | AI-driven forecasting, intelligent alerting, automated topology mapping | SaaS-only | Agentless monitoring for easier deployment, pre-built dashboards for 2,000+ technologies, 14-day free trial |
| Monte Carlo | Data warehouses (Snowflake, BigQuery, Redshift), data lakes, ETL pipelines | ML-based data quality monitoring, automated anomaly detection, lineage tracking | SaaS | Focused on data reliability and pipeline monitoring, prevents data downtime, ideal for data-driven SMEs |
| Arize AI | ML platforms (SageMaker, Azure ML, Vertex AI), model serving infrastructure | Model performance monitoring, drift detection, explainability features | SaaS, on-premises | Tailored for AI/ML model monitoring, tracks prediction accuracy and data drift, free tier for up to 100,000 predictions/month |
| WhyLabs | Cloud and on-premises, Apache Spark, Apache Kafka, MLflow, Amazon SageMaker | Data pipeline integrity monitoring, ML workflow tracking, statistical profiling | SaaS | Combines data quality and ML monitoring, lightweight integration, scalable for growing teams |
Key Considerations
When deciding among these tools, it's essential to weigh factors like deployment flexibility, pricing models, and AI capabilities. Here's a closer look at what might influence your choice:
- Deployment Options: If your team has limited IT resources, deployment flexibility is a big deal. Tools like Datadog and Dynatrace offer both cloud and self-hosted options, giving you control over data residency and costs. On the other hand, SaaS-only solutions like LogicMonitor and Monte Carlo remove the burden of infrastructure management, allowing smaller teams to focus on insights rather than upkeep.
- Pricing Models: Costs can vary widely. Datadog’s per-host pricing works well for predictable infrastructure needs, while Arize AI’s prediction-based pricing is ideal for businesses with fluctuating machine learning workloads. Grafana Labs stands out for budget-conscious teams, offering robust open-source capabilities before scaling into paid tiers.
- AI Features: The sophistication of AI capabilities differs across tools. Dynatrace’s Davis AI simplifies root cause analysis with minimal manual setup, making it a strong choice for teams new to AI-driven monitoring. For businesses focused on data and machine learning pipelines, Monte Carlo and WhyLabs offer specialized features that general-purpose tools might lack.
- Integration Ecosystem: The range of integrations can make or break your experience. Datadog supports over 600 integrations, covering nearly any technology stack. LogicMonitor’s 2,000+ pre-built dashboards streamline setup, while Arize AI focuses deeply on ML platforms.
Recommendations for SMEs
For SMEs, the choice often depends on your infrastructure complexity and growth plans. If you’re managing containerized, multi-cloud applications, Datadog or Dynatrace are solid picks. For data-centric operations, Monte Carlo or WhyLabs bring specialized capabilities to ensure data quality and reliability. Meanwhile, Grafana Labs appeals to teams with technical expertise looking for a cost-effective solution that doesn’t sacrifice functionality.
Conclusion
For small and medium-sized enterprises (SMEs) juggling complex technology stacks, cross-platform monitoring isn't just helpful - it’s essential. The AI-driven tools discussed here - Datadog, Dynatrace, Grafana Labs, LogicMonitor, Monte Carlo, Arize AI, and WhyLabs - each tackle specific challenges, whether it’s ensuring infrastructure visibility, maintaining data pipeline reliability, or improving machine learning model performance.
Automation is a game changer in this space. These tools go beyond simple monitoring by automating tasks like anomaly detection, predictive alerts, and root cause analysis. This not only slashes response times but also allows your team to focus on higher-value, strategic initiatives.
Choosing the right tool depends on your specific needs and growth trajectory. If you’re managing multi-cloud containerized environments, Datadog or Dynatrace could be your best bet. For ensuring data quality and pipeline reliability, Monte Carlo or WhyLabs are strong contenders. Grafana Labs offers advanced controls at a lower cost, while LogicMonitor provides a straightforward, agentless setup.
Pricing structures vary widely. Tools with per-host pricing work well for stable environments, while those with prediction-based models are better suited for dynamic machine learning workloads. Take advantage of free trials or free tiers to see which tool aligns with your needs before making a commitment.
Ultimately, the value of these tools lies in their ability to go beyond problem detection. They help uncover performance trends, optimize resource allocation, and guide smarter infrastructure investments. Start by identifying your biggest challenges - whether it’s cloud costs, application performance, data reliability, or model accuracy - and choose a tool that addresses those pain points directly. The right tool can give SMEs the clarity and control needed to manage their tech ecosystems effectively.
For even more ways to enhance your operations, check out AI for Businesses, where you’ll find tools designed to improve workflows, data analysis, content creation, and more.
FAQs
What’s the best way to choose an AI tool for cross-platform monitoring that fits my business needs?
To choose the best AI tool for cross-platform monitoring, start by pinpointing what your business truly needs. Think about the platforms you want to monitor, the specific data or performance metrics that matter most, and how much you're willing to spend. It's also essential to find a tool that integrates smoothly with your existing systems and offers features like automation, real-time alerts, and customizable dashboards.
The tool should match your objectives - whether you're aiming to boost marketing performance, streamline daily operations, or strengthen security measures. Don’t forget to assess how scalable the tool is, how simple it is to use, and the quality of its customer support. This way, you’ll ensure that it can grow with your business while providing an intuitive and hassle-free experience.
How do these AI monitoring tools differ in deployment options and pricing models?
AI monitoring tools come with flexible deployment options to match diverse requirements. Some of the most popular choices are:
- Self-hosting: Ideal for those who want full control over their data and infrastructure.
- API integration: Perfect for seamlessly embedding the tool into existing systems.
- Cloud deployment: A hassle-free option offering scalability and minimal setup effort.
When it comes to pricing, these tools cater to businesses of all sizes with a range of models:
- Subscription plans: Great for predictable, recurring costs.
- Pay-as-you-go: Offers flexibility by charging based on actual usage.
- Custom enterprise solutions: Designed for businesses with unique needs and requirements.
Choosing the best fit depends on your specific goals and operational needs.
How do AI features like anomaly detection and predictive analytics enhance performance monitoring across platforms?
AI-powered tools like anomaly detection and predictive analytics are game-changers for performance monitoring. Anomaly detection works by identifying irregular patterns as they happen, enabling teams to respond swiftly to any disruptions. Meanwhile, predictive analytics takes historical data and uses it to forecast trends, helping businesses address potential issues before they escalate.
By using these technologies, businesses can fine-tune system performance, minimize operational risks, and make smarter decisions based on data. This not only saves time but also helps conserve valuable resources.
