Want to understand how your brand’s reputation has evolved over time? Historical reputation trend analysis helps businesses track shifts in public sentiment, compare performance against competitors, and make data-driven decisions. By focusing on key metrics like brand awareness, customer sentiment, social media engagement, media coverage, and financial indicators, you can uncover patterns that inform future strategies.
Here’s a quick overview of what matters most:
- Brand Awareness & Share of Voice: Measure how familiar your audience is with your brand and your visibility compared to competitors.
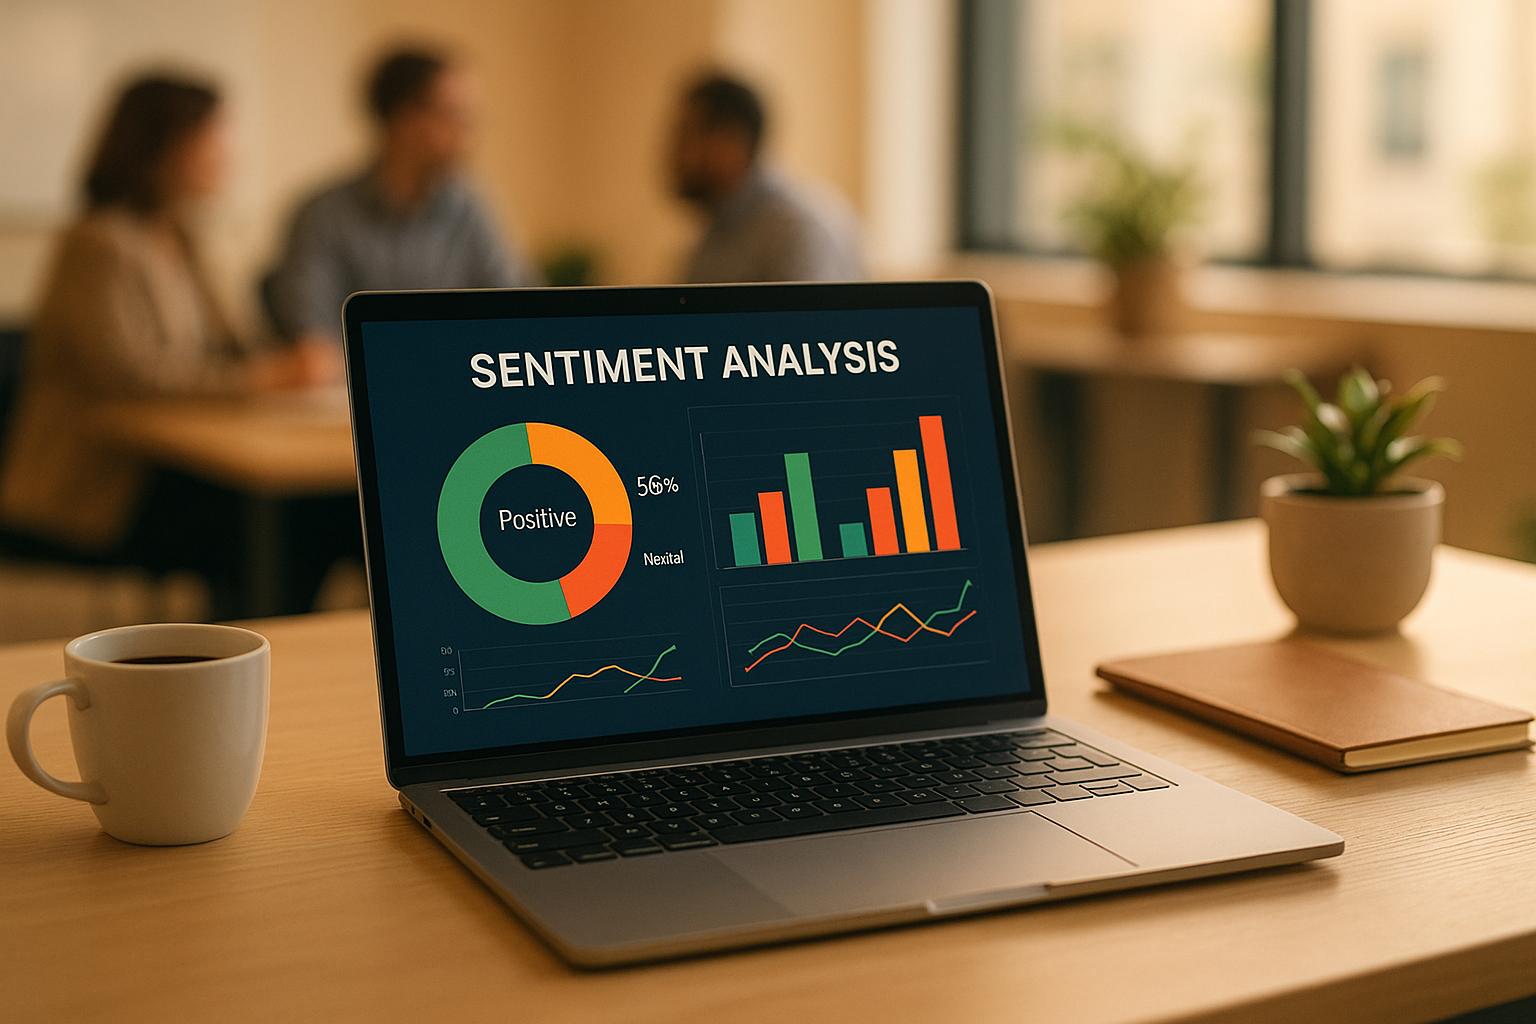
- Customer Sentiment & Satisfaction: Use metrics like Net Promoter Score (NPS) and sentiment analysis to gauge customer perceptions.
- Social Media Engagement: Track likes, shares, and comments to see how your audience interacts with your brand.
- Media Coverage: Analyze the tone and reach of your brand mentions in news and blogs.
- Financial Indicators: Connect reputation metrics to revenue, market share, and customer retention.
AI tools make this process faster, automating data collection and analysis from reviews, social media, and news outlets. This allows businesses to respond to reputation changes in real time and benchmark performance against competitors effectively. By 2025, 73% of companies are expected to use AI for customer experience management, showing just how critical these tools have become.
Dive into the full article to learn how these metrics and tools can shape your brand’s future.
How to measure sentiment in social media? 🙂😐🙁
Key Metrics for Historical Reputation Trend Analysis
To understand your brand's reputation over time and see how you stack up against competitors, focus on these five key metrics. They not only help track historical performance but also provide insights into your competitive position.
Brand Awareness and Share of Voice
Brand awareness measures how familiar your audience is with your brand. Share of voice (SOV), on the other hand, reveals your brand's visibility within the market compared to competitors, offering a snapshot of your market presence.
"Brand awareness is a measure of how familiar people are with your brand – whether they recognize your name, recall your products, or understand what sets you apart. It's the foundation of brand growth, helping you stay top-of-mind with potential customers and stand out in a crowded market." - Nicholas White, Head of Strategic Research, Attest
Studies show it takes 5 to 7 impressions for consumers to recall a brand. This makes brand recall - how easily customers remember your brand without prompts - just as important to measure.
To track these metrics, monitor branded search volumes in Google Analytics to see how often people search for your brand name. Use Google Trends to analyze mentions over time and benchmark against competitors. Social media follower growth can signal increased reach and familiarity, while earned media mentions with backlinks on third-party sites add another layer of insight.
For example, in 2023, Fenty dominated the beauty industry in share of voice, generating over 150 million engagements from buzz around their lip-gloss and makeup box collaborations.
Next, understanding how customers feel about your brand is equally critical.
Customer Sentiment and Satisfaction
Customer sentiment reveals how people perceive your brand, while satisfaction metrics like Net Promoter Score (NPS) and average review ratings offer tangible insights into customer experience. These are often early indicators of potential issues.
Consider this: 66% of consumers say a single bad experience can ruin their day, and losing customers due to poor service can cost businesses up to 6.7% of their revenue. On the flip side, customers who rate their experience 5/5 stars are more than twice as likely to make repeat purchases, with 80% of them increasing their spending.
While CSAT scores provide a snapshot of past experiences, sentiment analysis delves deeper into customer emotions, offering a better gauge of future behavior.
Invest in sentiment analysis tools to collect data from platforms like social media, review sites, and customer surveys. These tools can generate sentiment scores and track trends over time, helping you anticipate disruptions before they occur.
Once you have a grasp on sentiment, it’s time to evaluate how your audience interacts with your brand online.
Social Media Engagement and Follower Growth
Social media engagement metrics highlight how actively your audience interacts with your brand. High engagement rates signal an interested audience and can help pinpoint which types of content resonate most.
In 2024, the average daily engagements per post across industries was 14, offering a benchmark for comparison. But it’s not just about the numbers - quality matters too. Track likes, comments, retweets, and reactions to understand what’s working. Shares, in particular, are valuable since they extend your reach. Metrics like video completion rates and sentiment analysis can provide deeper insights into how your content is being received.
With 75% of consumers expecting same-day responses on social media, your response time and the quality of those responses play a big role in shaping your reputation.
Social media data pairs well with insights from media coverage to build a complete picture.
Media Coverage and Online Presence
The volume, tone, and reach of media coverage offer a window into how your brand is perceived in news outlets, blogs, and other publications. Earned media, often viewed as more credible than paid advertising, is particularly telling.
Track media mentions across platforms and analyze their tone - positive, negative, or neutral. Identify which topics drive the most attention and compare this to your competitors.
Additionally, monitor search engine visibility. Key metrics include keyword rankings, branded organic traffic, and authority scores. Use tools like Google Analytics to review referral traffic from media coverage and focus on engaged users rather than those with high bounce rates. AI-powered search analytics can also provide valuable insights into how your brand is performing online.
Ultimately, these visibility metrics tie back to financial outcomes.
Financial Reputation Indicators
Financial metrics reflect stakeholder trust and the real-world impact of your reputation. Metrics like revenue growth, profit margins, market share, and stock performance can show how reputation translates into business results.
Though financial outcomes often lag behind other indicators, they provide hard evidence of your brand's influence. For instance, 89% of shoppers stay loyal to brands that align with their values, directly impacting financial performance.
To connect reputation and financial outcomes, track revenue growth alongside reputation metrics. Look at customer acquisition costs, lifetime value, and for B2B companies, contract renewal rates and deal sizes. Comparing your financial performance to competitors during the same period can reveal whether shifts in reputation are giving you an edge. This can also inform strategies to mitigate competitive risks.
sbb-itb-bec6a7e
Methods for Tracking and Analyzing Trends
Using AI tools to automate data collection, analysis, and visualization can transform key reputation metrics into actionable insights, giving businesses a competitive edge.
Automating Data Collection with AI Tools
Manually gathering data for reputation analysis is not only tedious but also prone to mistakes. AI tools simplify this process by automating how information is extracted, analyzed, and validated from various sources. These tools rely on techniques like web scraping, natural language processing, and entity recognition to ensure accuracy and efficiency. Before picking a tool, outline your specific data needs. Look for platforms with pre-built templates for different document types and integration features that align with your existing systems.
AI tools with customizable dashboards and seamless integration capabilities can significantly reduce manual errors while speeding up data collection.
"Today's LLM pipelines cluster themes, pinpoint the root cause, and push a short action brief to your Slack before a hashtag starts trending." – Ernesto Wong, CEO of IMomentum
This level of automation allows businesses to react to reputation changes in real time, rather than weeks after an issue arises. Once the data is collected, compare your metrics against competitors to uncover actionable insights.
Benchmarking Competitors' Metrics
Benchmarking is essential for measuring your brand’s performance against its peers. By tracking indicators like review scores, response times, and customer sentiment, you can see where you stand in the industry. AI tools make this process faster and more precise by automating data collection and analysis. Start by pulling data from reviews, surveys, social media, and competitor performance to create a complete picture.
The advantage of AI-driven benchmarking lies in its ability to dig deep into data, identifying trends and recurring issues. This provides real-time insights that help you adapt quickly to market shifts. Emily Keenan, Content Marketing Specialist at Widewail, highlights the importance of this approach:
"AI-powered benchmarking makes it possible to shift from reacting to controlling your reputation. This tool doesn't just skim the surface - it digs deep to provide real-time insights that show where you stand, pinpoint what needs work, and give you the edge to outshine your competitors."
For example, the 2024 Widewail Automotive Voice of the Customer Report used AI to discover that poor communication was the most common complaint in negative automotive reviews. Insights like these allow businesses, such as dealerships, to refine their operations. When selecting AI tools for benchmarking, focus on those that provide actionable insights and allow for customization based on your industry’s specifics. Regular AI-generated reports can help track progress, identify trends, and guide data-driven decisions to stay ahead of competitors.
Visualizing and Reporting Trends
Once your data is collected and benchmarked, visualization helps turn raw numbers into meaningful decisions. Clear and concise data presentation is critical. Dashboards act as a command center, showcasing real-time metrics and historical trends in one place. The most effective dashboards prioritize key performance indicators, like sentiment scores over time or competitor comparisons, rather than overwhelming users with excessive data points.
For visualizing trends, line graphs are great for tracking changes over time, while heatmaps provide instant visual cues about performance variations. For example, multiple lines on a graph can compare your performance to competitors, and heatmaps can highlight differences in sentiment across platforms or peak engagement times on social media.
Turning visualized data into actionable insights is the ultimate goal. Each chart or graph should answer critical questions: Are our metrics improving? How do we stack up against competitors? What areas need immediate attention? Adding context is key - for instance, a 10% rise in negative sentiment might be less alarming if it comes with a 50% surge in overall mentions. Automated reporting can streamline this process by delivering regular updates, like weekly or monthly summaries, while also allowing for on-demand reports when specific issues arise.
Platforms like AI for Businesses offer curated AI tools for small to mid-sized companies, streamlining data visualization and reporting. Tailor your reporting to your audience: executives may prefer high-level summaries, while marketing teams might require detailed breakdowns to fine-tune campaigns. By customizing your approach, you ensure that everyone gets the insights they need to act effectively.
Conclusion and Summary
Key Takeaways
Understanding and analyzing historical reputation trends is more than just a smart move - it’s a necessity in today’s competitive market. The numbers speak for themselves: 90% of customers check online reviews before making decisions, and reputation accounts for around 25% of a company’s market value. Keeping a close eye on reputation metrics isn’t optional; it’s essential.
AI-powered reputation analysis has changed the game, turning massive amounts of data into simple, actionable insights. Businesses can now use automated tools to detect patterns, predict shifts in the market, and tackle potential reputation risks before they become serious issues.
To benchmark effectively, companies need to focus on the right metrics, gather data from multiple sources, and apply AI insights to fine-tune their strategies. The most successful businesses don’t just react to reputation changes - they anticipate them. In fact, companies with strong reputations enjoy the trust of nearly 95% of their customers, proving the value of proactive reputation management.
This proactive approach allows businesses to identify their strengths and find areas for improvement by comparing their performance to industry standards. These insights pave the way for utilizing cutting-edge AI tools to stay competitive.
How AI for Businesses Can Help
To make these strategies actionable, AI for Businesses provides a carefully curated directory of tools tailored for small and medium-sized enterprises (SMEs) seeking advanced reputation analysis without unnecessary complexity. With the metrics and trends highlighted above, SMEs can now tap into AI-driven solutions to maintain a competitive edge.
The platform features tools like Looka for ensuring consistent brand design, Writesonic for creating content that aligns with your brand’s voice, and Stability.ai for producing visual assets that enhance reputation management efforts. These tools simplify everything from data collection and reporting to brand management, delivering results that matter.
FAQs
How do AI tools help brands analyze historical reputation trends more effectively?
AI tools make it easier to analyze historical reputation trends by automating how data from online mentions is collected and interpreted. With the help of natural language processing (NLP) and machine learning, these tools can detect shifts in public opinion, monitor customer sentiment, and spot new trends as they emerge.
They go a step further by examining the emotional tone behind mentions, providing a more detailed view of a brand's health over time. This empowers businesses to address potential PR challenges early, adjust their strategies effectively, and maintain a competitive edge in an ever-changing market.
What are the best ways to track brand awareness and customer sentiment over time?
To keep tabs on brand awareness and customer sentiment over time, start with regular customer surveys and focus groups. These methods give you direct insights into how people perceive your brand. Pair this with social listening tools to track online mentions and gauge sentiment trends. These tools provide real-time feedback on customer opinions.
You can also measure branded search volume through platforms like Google Trends, monitor the growth of your social media followers, and evaluate earned media coverage. Together, these metrics paint a clear picture of your brand’s visibility and reputation. By combining these approaches, you’ll spot trends and gain the insights needed to make smarter decisions for building a stronger brand.
Why are financial indicators important for understanding a brand's reputation trends?
Financial indicators are a critical part of shaping how a brand is perceived, as they reveal the company’s overall health and performance. Metrics such as profitability, revenue growth, and cash flow carry significant weight in influencing the opinions of customers, investors, and stakeholders. When a company shows strong financial results, it often earns trust and credibility. On the flip side, poor financial performance can weaken public confidence.
Consistently monitoring these indicators over time allows businesses to understand how shifts in financial health affect their reputation. This understanding is crucial for identifying potential risks, spotting new opportunities, and making well-informed decisions in a competitive landscape.