Most small businesses do not need a big security stack to spot attacks early. I’d start with 5 core log sources, use 1 detection platform, and keep alert volume low enough that a team of 1 to 2 people can handle it.
Here’s the short version:
- 43% of data breaches target small businesses
- Start with logs from identity, email, endpoints, cloud activity, and network edge
- Pick the stack that fits your setup:
- Cloud-native SIEM/XDR for Microsoft 365, Azure, or Google-heavy teams
- Wazuh if you run both on-prem and cloud and want lower software spend
- Keep your first alerts focused on:
- account takeover
- admin changes
- suspicious scripts
- mass file access
- MFA abuse
- Plan for 90 days of searchable logs first, then extend retention if PCI DSS, HIPAA, or other rules require more
- A small IT team can usually review only 20 to 50 useful alerts per day, so tuning matters as much as collection
If I were setting this up on a tight budget, I would keep the rollout simple: turn on the smallest useful log set, normalize key fields, label assets, let behavior models learn for 1 to 2 weeks, and send only the highest-risk alerts to chat or email.
That is the core idea of lightweight AI intrusion detection: less data, fewer alerts, better signal.
How Is AI Used In Intrusion Detection Systems? - Emerging Tech Insider
Step 1: Choose the Minimum Viable Log Sources
More data is not always better. For a small team, pulling in too many logs too early creates noise, drives up storage costs, and floods you with alerts no one has time to check. The goal is the smallest useful log set - the sources that give you solid detection coverage where it matters most. Start with the logs that give you the most coverage for the least work.
Start With Identity, Email, Endpoint, Cloud, and Network Logs
Start with identity logs. Most modern breaches begin with identity compromise [3]. Turn on sign-in success and failure, MFA challenges, token refreshes, and privileged role changes in Microsoft Entra ID or Okta. If you use Google Workspace, enable the matching admin and audit logs there too.
Next, add endpoint logs from Windows Event Log or your EDR agent. Then bring in cloud control-plane logs such as AWS CloudTrail, Azure Activity Logs, or GCP Audit Logs. At this stage, focus on IAM changes, API calls, and security group edits - not full network flow data.
Email audit logs from Microsoft 365 or Google Workspace should also be part of the core set. Watch for new mailbox forwarding rules and OAuth app consent grants. Those changes often stick around even after a password reset [8][5].
Add VPN and firewall logs last. They produce a lot of data and usually take more work to collect and filter.
Rank Log Sources by Detection Value and Collection Effort
Not all log sources pull their weight. Rank them by detection value first, then by collection effort. That helps you decide what to turn on now and what can wait.
| Log Source | Detection Value | Data Volume | Collection Effort | SME Use Case |
|---|---|---|---|---|
| Identity (Entra ID / Okta) | Critical | Low | Low | Detect account takeover, MFA fatigue, and impossible travel |
| Endpoint (EDR / Windows Event Log) | High | High | Medium | Catch malware, suspicious scripts, and lateral movement |
| Email (M365 / Google Workspace) | High | Medium | Low | Spot mailbox forwarding rules and OAuth abuse |
| Cloud (AWS CloudTrail / Azure Activity Logs / GCP Audit Logs) | High | Medium | Medium | Detect privilege misuse and unauthorized configuration changes |
| Network (VPN / Firewall) | Medium | Very High | High | Expose command-and-control and data exfiltration |
Normalize and Label Logs Before Turning On AI Alerts
Before you turn on AI alerts, clean up the data. Raw logs use different field names and formats, so you need to standardize the main fields across every source: user, device, source IP, action, timestamp, asset, and severity [3]. If you skip this step, the AI model will struggle to connect a VPN login with a cloud file download from the same account.
Standardize timestamps too. Use one U.S. time zone across your log sources so incident timelines stay consistent and investigations move faster.
Then tag each log with a few simple labels: Environment, Asset Owner, and Business Unit [4]. These labels give a small team or MSP fast context. When an alert lands, they can judge the blast radius without digging through asset inventories.
Clean, labeled data cuts false positives before you write a single detection rule. That matters a lot when one person is doing triage in between other IT work.
Step 2: Pick a Deployment Model That Fits Your Setup
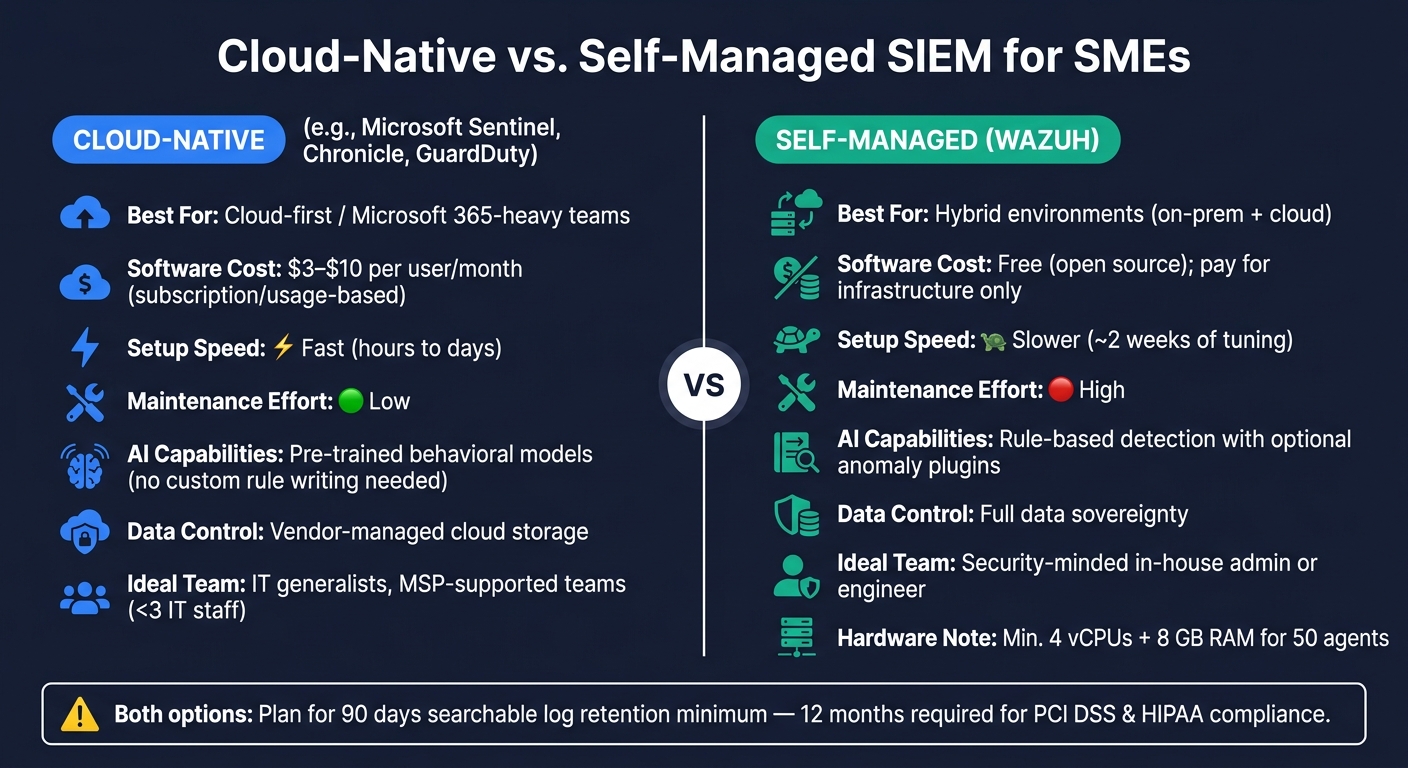
Cloud-Native vs. Self-Managed SIEM: SME Security Stack Comparison
Choose the deployment model that lines up with your environment, available staff time, and monthly budget. Cloud-first teams usually get live faster with managed detection. Hybrid teams often need more control.
Use Cloud-Native Detection for Cloud-First Environments
If most of your business runs on Microsoft 365, Azure, or Google Workspace, cloud-native detection is usually the faster path with less upkeep. Microsoft Sentinel pulls in Azure AD and Microsoft Defender logs at no added cost and comes with pre-built AI analytics and response playbooks out of the box [2]. In practice, that means you can start getting identity alerts in hours or days - not months [1].
Another plus: its pre-trained behavioral models can flag identity and privilege anomalies without custom rule writing [1][5]. That matters if your team doesn’t have time to build detections from scratch.
Managed SIEM-as-a-Service is often a good fit for teams with fewer than 3 IT staff. Options in this group usually cost $3 to $10 per user per month and send actionable alerts, not just raw event data [2]. That difference is a big deal when nobody on the team has detection engineering experience.
Use Wazuh for Hybrid Environments at Lower Software Cost
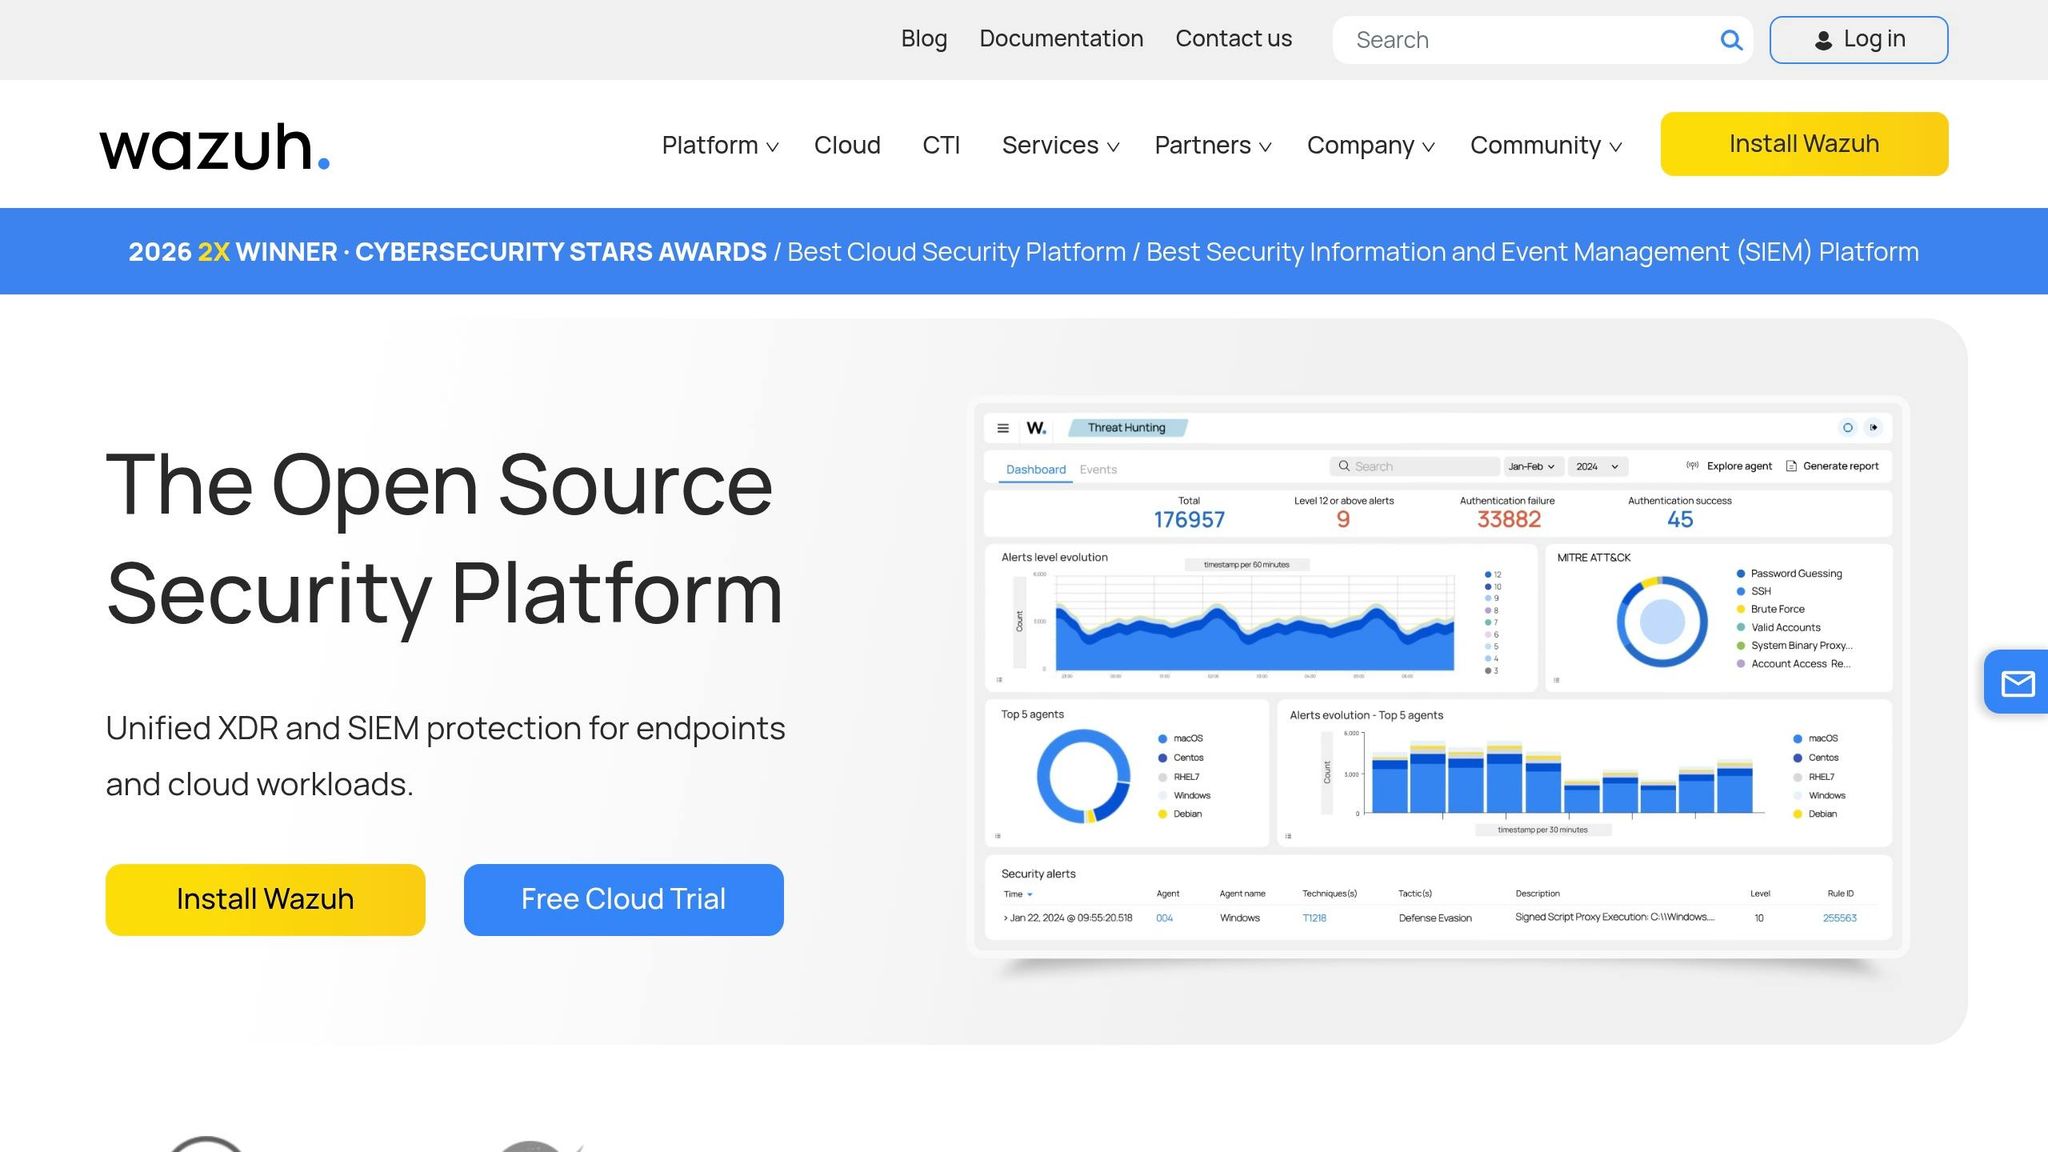
If you have a mix of on-prem servers and cloud workloads, Wazuh is a practical open source SIEM/XDR. Its agents run across Windows, Linux, and macOS no matter where the machine lives [9]. The software itself is free. Your costs come from the host VM and storage.
The tradeoff is time. The main cost is admin effort, not licensing. Wazuh usually takes about 2 weeks of tuning before alert volume drops to something your team can handle [9]. So pick the stack your team can maintain every week - not the one with the longest feature list.
For 50 agents, plan for at least 4 vCPUs and 8 GB of RAM. The OpenSearch-based indexer uses a lot of memory and tends to struggle on smaller instances [6][9]. Storage also adds up fast. Wazuh defaults to 90 days of log retention, but many compliance frameworks such as PCI DSS and HIPAA require 12 months, so you’ll need to budget for extra storage [9][6].
Compare Monthly Cost, Admin Time, Growth, and Ownership Before Choosing
| Cloud-Native (e.g., Sentinel, Chronicle, Defender, GuardDuty) | Self-Managed (Wazuh) | |
|---|---|---|
| Best Environment | Cloud-first / M365-heavy | Hybrid (on-prem + cloud) |
| Software Cost | Subscription / usage-based | Free open source; infrastructure only |
| Setup Speed | Fast | Slower |
| Maintenance Effort | Low | High |
| AI Capabilities | Pre-trained behavioral models | Rule-based detection with optional anomaly plugins |
| Data Control | Vendor-managed cloud storage | Full data sovereignty |
| Operational Ownership | IT generalists, MSP-supported teams | Security-minded in-house admin or engineer |
Once you pick the stack, keep the first alert set narrow. The next step is to tune alerts so a small team can act on them without overload.
sbb-itb-bec6a7e
Step 3: Tune Alerts So a Small Team Can Act on Them
Get the alert volume down to something a small team can handle. If you skip tuning, the queue fills up fast and people stop trusting it. A team of 1 or 2 can usually triage only 20-50 meaningful alerts per day [9]. That’s the point where many SME detection programs fall apart.
Start With a Short List of High-Value Alerts
Begin with the alerts most tied to account takeover, privilege misuse, and malware execution. Keep the list tight:
- Failed login followed by success from a new IP
- New admin account or security-setting change
- Suspicious PowerShell with encoded commands
- Mass file access or download from SaaS
- MFA fatigue or dormant account used for admin actions
This is the right starting point for a small team. You want alerts that point to likely abuse, not a long stream of low-risk noise.
Cut False Positives With Whitelists, Thresholds, and Baselines
Most early alert noise comes from the same few sources. Fix those first. The table below shows common false-positive cases and the tuning move to make.
| False-Positive Scenario | Triggering Event | Specific Tuning Action |
|---|---|---|
| Monitoring service accounts | Repeated failed logins during health checks | Suppress alerts for the service account. |
| Vulnerability scanners | Massive connection attempts or port scans | Whitelist the scanner IP. |
| Traveling staff | Impossible travel or 3 AM login alerts | Add the user's travel pattern to the baseline. |
| Authorized admin changes | Password resets or permission shifts by IT | Allow only verified admin IPs during business hours. |
| Noisy protocols | Frequent alerts for legacy protocols like NetBIOS | Disable noncritical legacy-protocol rules. |
Be strict with suppressions. Limit them to named accounts, specific IPs, or narrow conditions, and audit them every quarter. In Wazuh, CDB lists make this pretty simple. You can match logs against known office IP ranges, trusted SaaS ranges, and approved service accounts without much setup work.
Set a Simple Triage Routine for IT Generalists or MSPs
This setup is for IT generalists or MSPs, not a dedicated SOC. So the playbook needs to be simple and clear before anything goes wrong.
| Severity | Target Response Time | SME Operating Action |
|---|---|---|
| Critical | 15 minutes | Revoke sessions, isolate the endpoint, preserve logs. |
| High | 2 hours | Review recent password resets and MFA status. |
| Medium | 24 hours | Document findings and update suppressions. |
| Low | Weekly review | Review dormant accounts and config drift. |
One rule matters across every automated response: preserve logs and original files before any destructive action. If you wipe, isolate, or disable first, you may lose the trail you need later for forensics or compliance audits. And for production servers or executive accounts, require human approval before isolation or disablement.
Step 4: Follow a 30-Day Starter Plan on a Limited Budget
Once your log sources, deployment model, and alert set are in place, use the next 30 days to prove the setup in production. The goal is simple: test the smallest useful log set and a single detection stack under live traffic.
Weeks 1–2: Inventory Assets and Turn On Core Logging
Week 1: Identify your critical systems, admin accounts, cloud apps, regulated data such as financial records and customer PII, and the owner for each. Then review current logging coverage to see what's already being recorded and what's getting dropped [1].
Week 2: Centralize the logs you already have. Start with identity, cloud control-plane, and endpoint events. Add new sources only after that core coverage is live [3][4]. For retention, 90 days of searchable data is a practical place to start, even if compliance later calls for 12 months. A simple way to control cost is to keep high-value identity and privileged-access logs longer, while cutting retention for noisy, low-value logs [3][7].
Once core logging is live, move to one detection stack and one notification path.
Week 3: Enable One Detection Stack and Set Up Notifications
Pick one stack and stick with it for the full 30 days. Connect your highest-priority log sources - identity, email logs, firewall, and endpoints - and let the AI models run for 1 to 2 weeks so they can build a baseline of normal behavior [1]. Send only critical alerts to chat. Put everything else into a queue for weekly review.
Conclusion: Start Small, Tune Fast, and Build From What You Learn
By Day 30, you should have a working signal path, a baseline for normal behavior, and fewer blind spots than you had on Day 1 [3][7][1].
Track a small set of metrics from there:
- Mean time to detect (MTTD)
- Mean time to contain (MTTC)
- The share of alerts that are actually meaningful
- Analyst minutes spent per case
If those numbers improve month over month, the stack is doing its job.
SMEs don't need a big security team to run intrusion detection well. They need a tight scope, the right log sources, one deployment model that fits their setup, and the discipline to tune before adding more. Start there, then build from what actual incidents and false positives show you.
FAQs
How much setup time should a small team expect?
Small teams can usually get AI-driven intrusion detection up and running far faster than older systems - often in hours or days, not months. A big reason is that cloud-native platforms remove the need to buy, rack, and manage on-premises hardware.
Setup time can vary quite a bit. Some open-source SIEM deployments take as little as 5 minutes, while others need about 40 minutes for a base install and another hour for full configuration.
The main thing that makes or breaks deployment is scope. Teams that start with a minimum viable telemetry set tend to move faster and avoid getting buried in setup work.
Which log source should I add first if I can only choose one?
Start with identity provider logs. They’re the highest-value first source because many modern breaches start with stolen or abused credentials.
These logs show login successes and failures, MFA events, token refreshes, impossible-travel activity, and directory changes. That gives you an early view into unauthorized access and privilege escalation.
When should an SME move beyond the minimum setup?
An SME should go past the minimum setup when that setup stops serving the business.
The most common trigger is outside pressure. That usually means compliance rules like NIST, PCI DSS, or HIPAA, or cyber insurance requirements that call for stronger logging and monitoring.
It also makes sense to scale when day-to-day work starts to break down. For example:
- Alert volume is higher than your team can investigate
- Manual maintenance is eating up too much time
- You have enough organization-specific labels to support more precise custom detection models
At that point, sticking with the baseline often means more noise, more manual work, and less control over what your team is seeing.