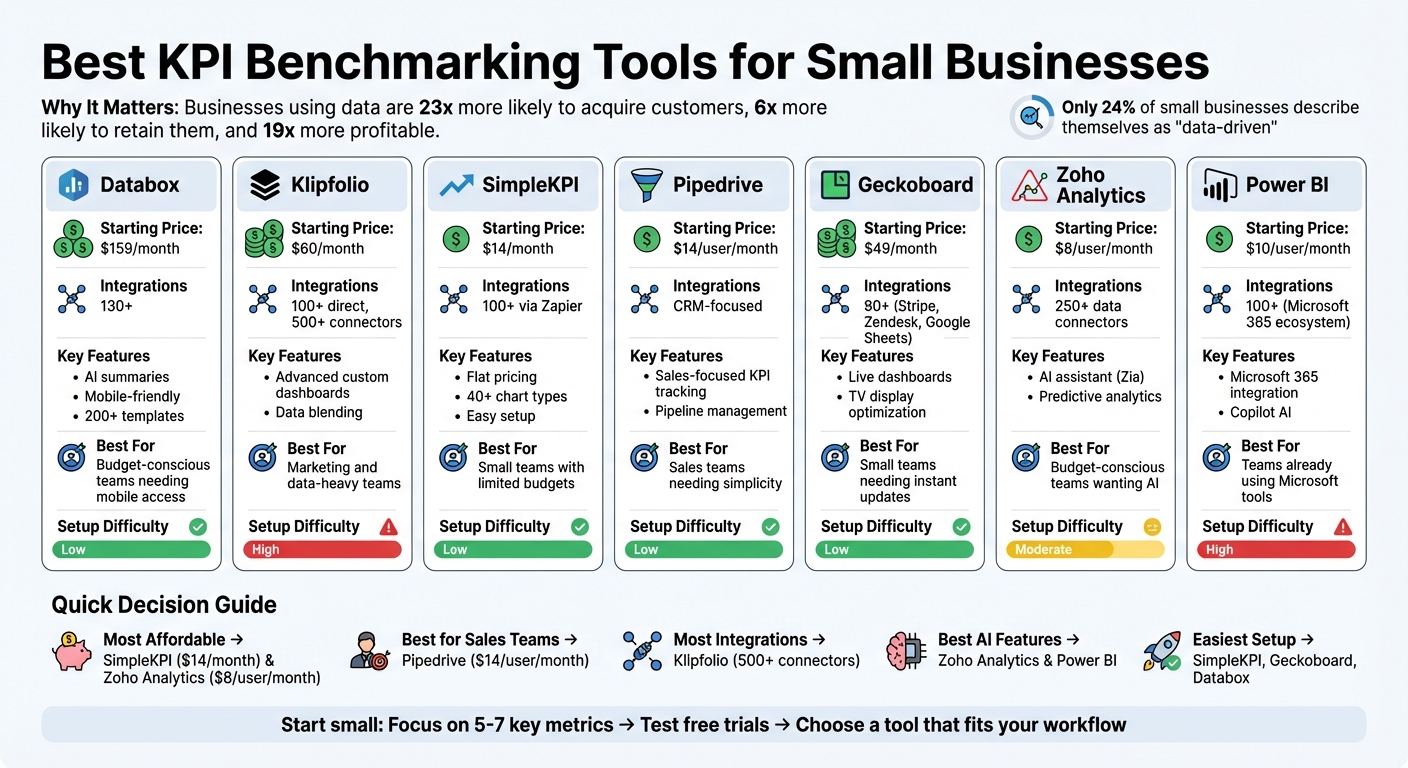
Running a small business without tracking KPIs is like driving without a map. KPI tools help you monitor critical metrics - like cash flow, customer acquisition costs, and conversion rates - so you can make informed decisions and improve profitability. Here’s the key takeaway: businesses using data are 23x more likely to acquire customers, 6x more likely to retain them, and 19x more profitable. Yet, only 24% of small businesses describe themselves as "data-driven."
The good news? Modern KPI tools are affordable, easy to use, and integrate with platforms like Google Sheets, QuickBooks, and CRMs. They save time, simplify data tracking, and provide actionable insights without requiring technical skills. Below are some of the best tools for small businesses:
- Databox: Mobile-friendly with over 130 integrations; starts at $159/month.
- Klipfolio: Customizable dashboards with 100+ integrations; starts at $60/month.
- SimpleKPI: Easy setup, flat pricing; starts at $14/month.
- Pipedrive: CRM with built-in KPI tracking for sales teams; starts at $14/user/month.
- Geckoboard: Simple, live dashboards for team visibility; starts at $49/month.
- Zoho Analytics: AI-powered insights and predictions; starts at $8/user/month.
- Power BI: Works seamlessly with Microsoft 365; starts at $10/user/month.
Quick Comparison
| Tool | Starting Price | Key Features | Best For |
|---|---|---|---|
| Databox | $159/month | AI summaries, 130+ integrations | Budget-conscious teams needing mobile access. |
| Klipfolio | $60/month | Advanced custom dashboards | Marketing and data-heavy teams. |
| SimpleKPI | $14/month | Flat pricing, easy setup | Small teams with limited budgets. |
| Pipedrive | $14/user/month | Sales-focused KPI tracking | Sales teams needing simplicity. |
| Geckoboard | $49/month | Live dashboards for team visibility | Small teams needing instant updates. |
| Zoho Analytics | $8/user/month | AI insights, 250+ integrations | Budget-conscious teams wanting AI. |
| Power BI | $10/user/month | Microsoft 365 integration, AI tools | Teams already using Microsoft tools. |
Start small by focusing on 5–7 key metrics, test a free trial, and choose a tool that fits your workflow. These tools simplify tracking and help you make smarter decisions for long-term growth.
KPI Benchmarking Tools Comparison: Pricing, Features, and Best Use Cases for Small Businesses
Top KPI Benchmarking Tools for Small Businesses
Databox
Databox is a mobile-friendly platform that connects with over 130 data sources, including HubSpot, Salesforce, Google Analytics, and QuickBooks. It simplifies performance tracking with AI-powered summaries that explain your metrics and offer actionable suggestions - perfect for users without a technical background.
Mary White, VP of Operations at MarketLauncher, shared how Databox transformed her team's workflow:
"Before Databox, we had a whiteboard where we kept track of all of our KPIs. It used to take hours every week to update the data... We now do it in probably 10 or 12 minutes because of Databox."
Databox offers a free plan for up to three data sources, with professional plans starting at $159/month and growth plans at $399/month. Its pre-built templates and drag-and-drop designer make it easy to get started, while SMART goals and real-time alerts through Slack, email, or mobile keep you updated when metrics reach key thresholds - an excellent option for small businesses watching their budgets.
Next up is Klipfolio, known for its seamless integration with diverse data platforms.
Klipfolio
Klipfolio connects to over 100 platforms and provides deep integration options, making it a great choice for small businesses managing data from marketing tools, CRMs, and spreadsheets. Its pre-built templates and branded dashboards are especially popular with agencies and marketing teams for client reporting.
Pricing starts at $60/month for the Professional plan, with Team plans available at $120/month when billed annually. Trusted by over 10,000 teams worldwide, Klipfolio is recognized as a "High Performer" for small teams needing tailored dashboards. Its data blending capabilities allow businesses to create unified views from multiple systems - another solid choice for small businesses on a budget.
SimpleKPI
SimpleKPI is an easy-to-use platform designed to replace manual spreadsheet tracking with intuitive KPI visualization. It offers more than 40 chart types, including gauges, progress bars, and trend lines, all tailored for KPI tracking. With users like the NHS and Merck, SimpleKPI stands out for its flat pricing model, which appeals to small businesses.
Plans start at $14/month for the Starter tier, $49/month for the Growth plan (up to five users), and $99/month for the Unlimited plan with no additional per-user fees. Users appreciate its simplicity, enabling even non-technical staff to create dashboards from day one. It's a practical option for businesses looking for quick adoption without breaking the bank.
Pipedrive
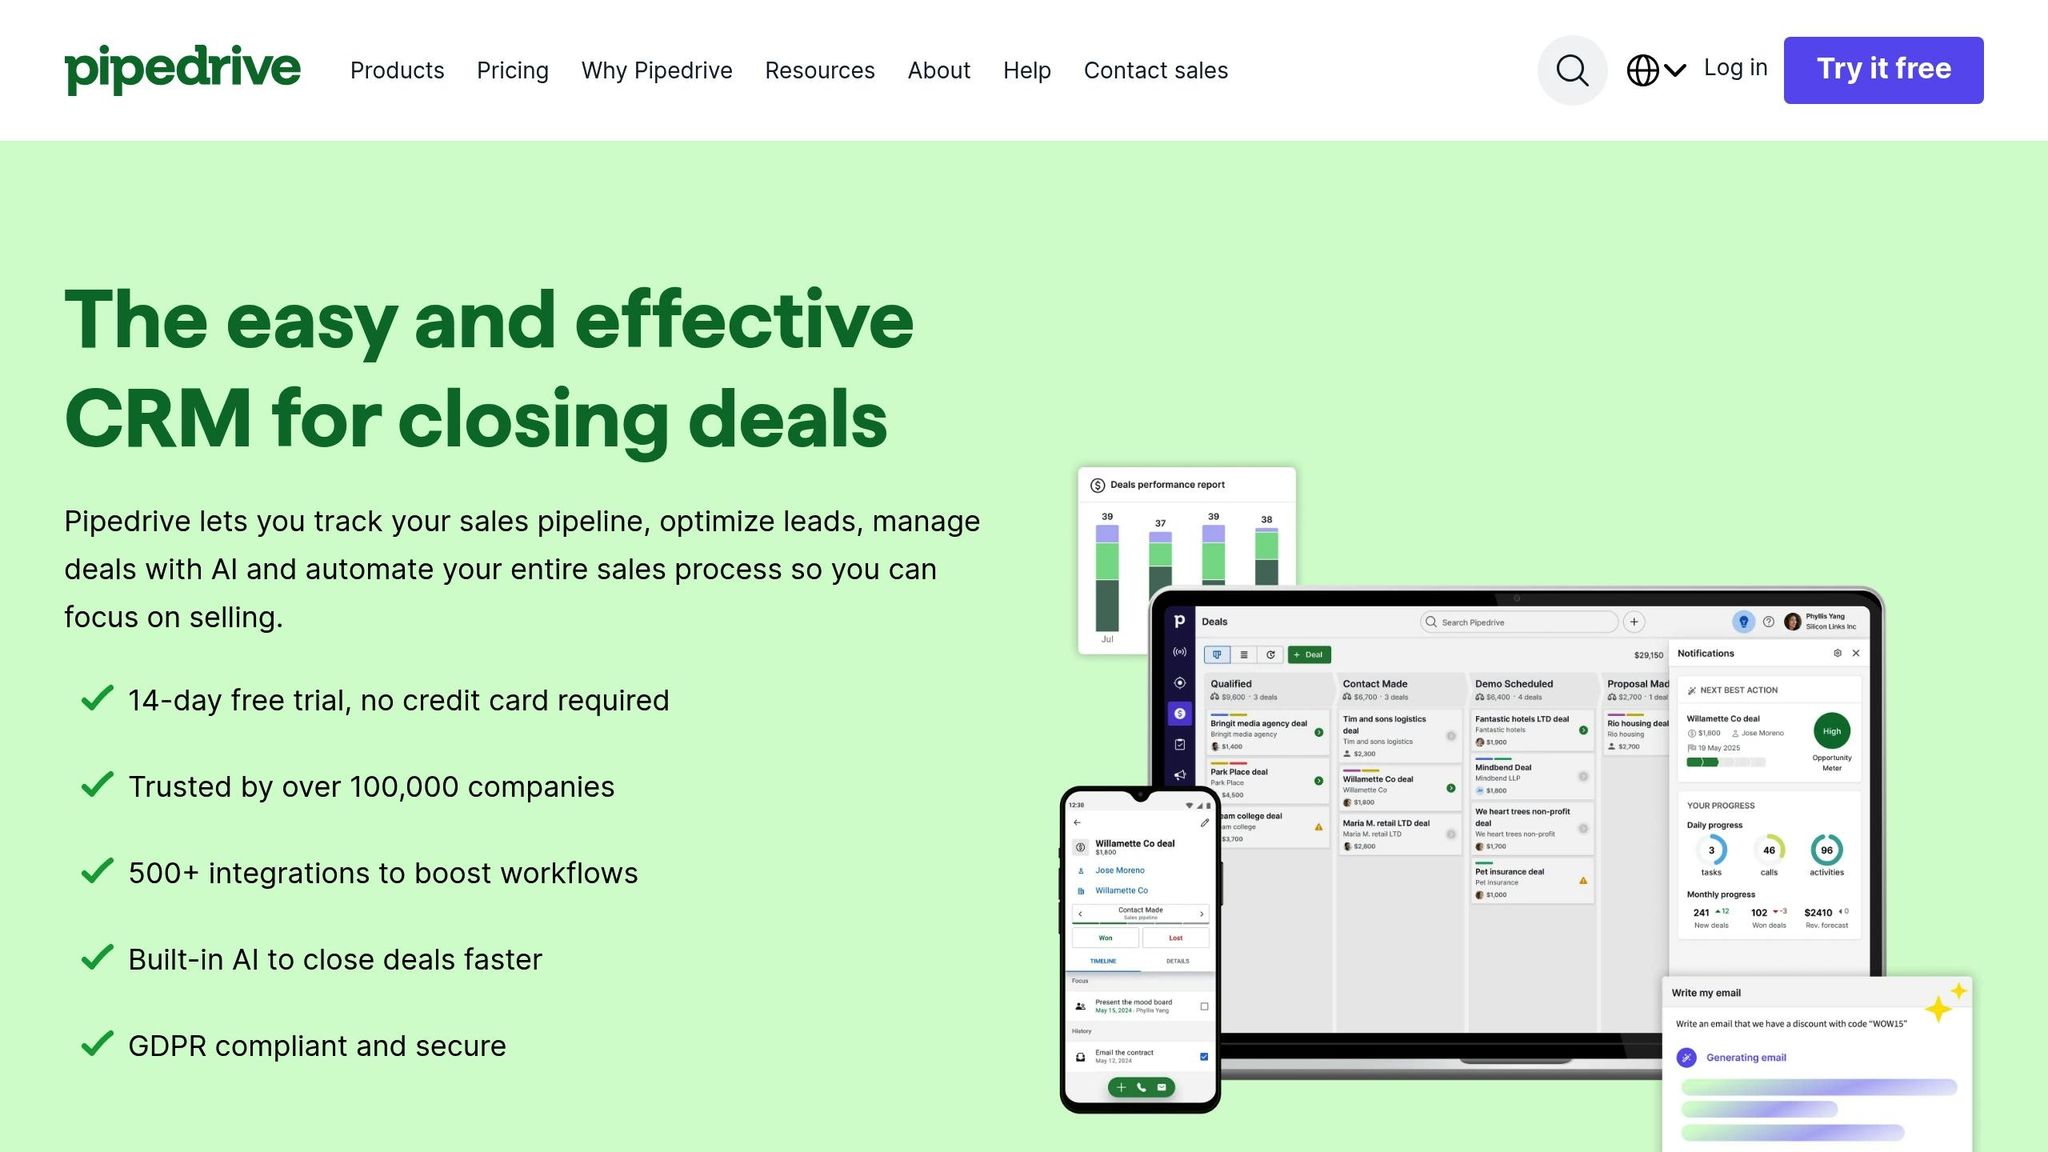
Pipedrive is a CRM built with sales teams in mind, offering built-in KPI tracking alongside its sales pipeline management. Its interactive dashboards track metrics like conversion rates, deal velocity, and revenue forecasts in real time. Pricing starts at $14 per user per month when billed annually, making it a focused solution for small sales teams without unnecessary cross-departmental features.
For teams requiring real-time visibility across devices, Geckoboard offers a streamlined alternative.
Geckoboard
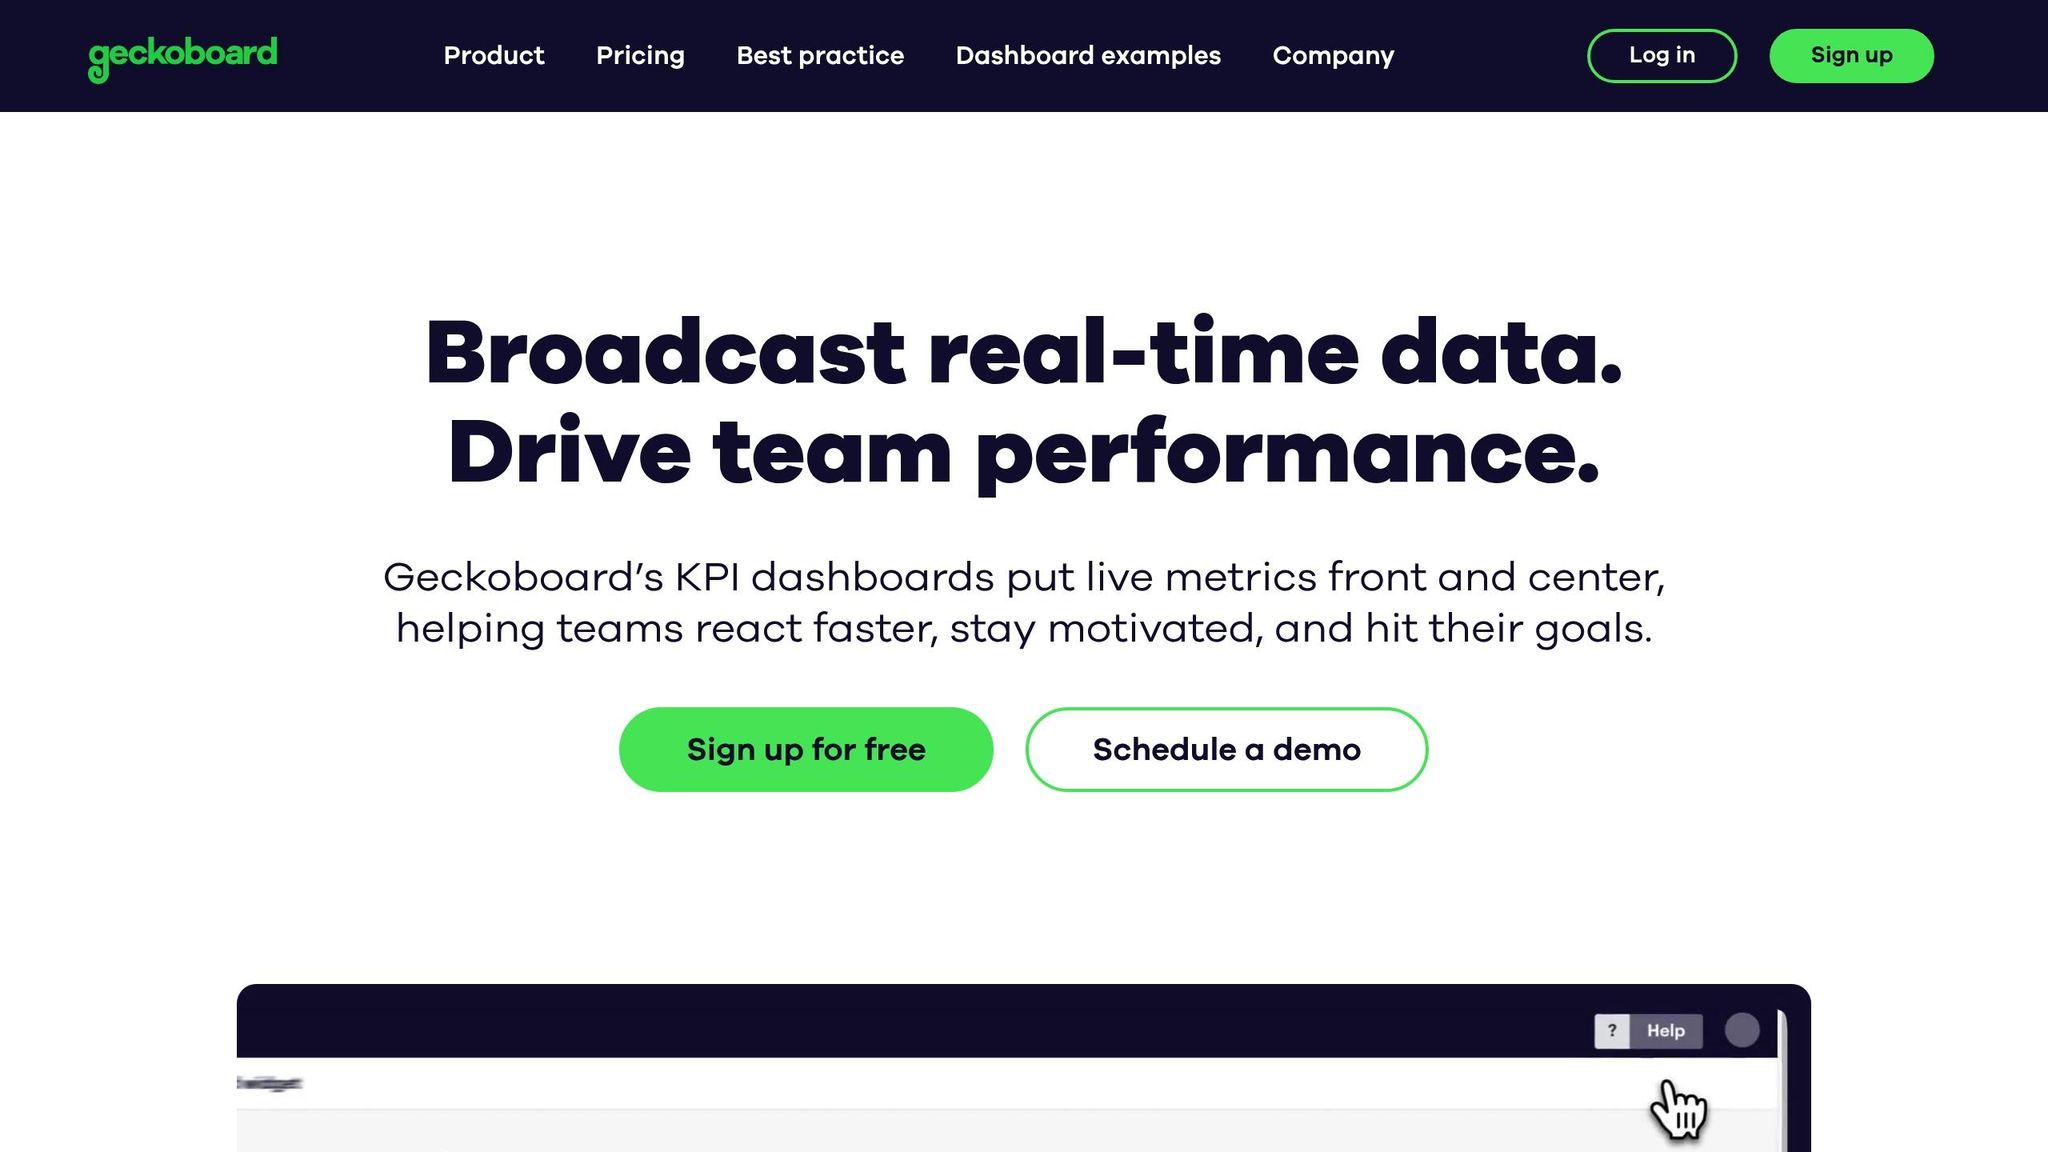
Geckoboard is designed for instant visibility, featuring a simple interface optimized for office TV displays and mobile devices. It integrates with tools like Google Analytics and Salesforce, allowing teams to create live dashboards that keep everyone aligned on key metrics. Trusted by over 5,000 clients, including Buffer and Zapier, Geckoboard’s Essential plan starts at $49/month, and most users can set up their first dashboard in minutes.
Its design organizes metrics into "health" indicators (e.g., revenue) and "action" items (e.g., tickets awaiting response), making it a valuable tool for remote teams or workplaces where visible metrics are critical. It's another strong choice for small businesses focused on affordability and efficiency.
sbb-itb-bec6a7e
5 KPI Dashboard Examples (from Real Businesses)
Advanced Features in Popular KPI Tools
Modern KPI tools go beyond basic tracking by incorporating AI automation and intuitive visualizations, making data analysis more accessible and actionable.
Zoho Analytics
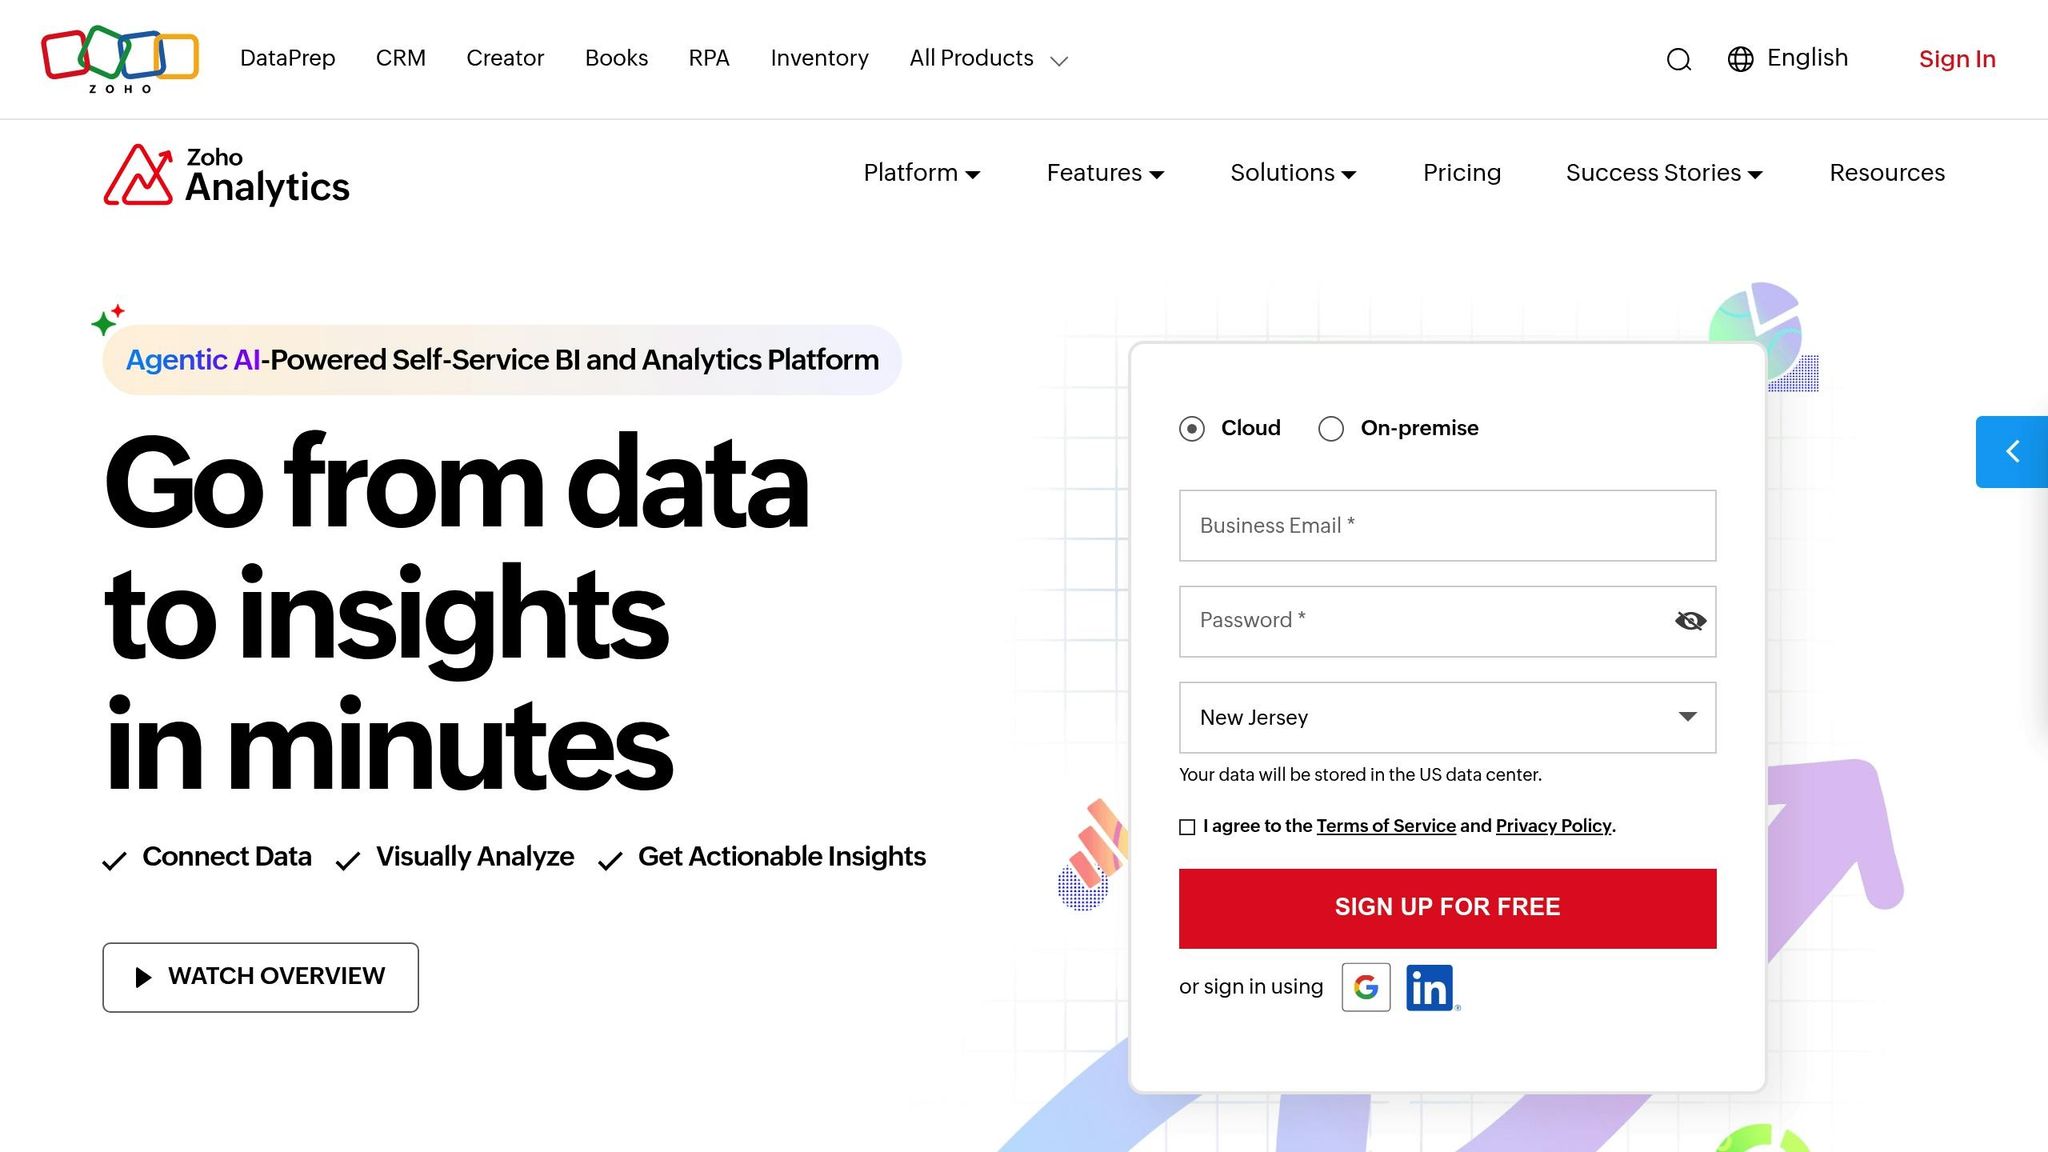
Zoho Analytics uses AI to simplify data insights for small businesses. Its assistant, Zia, relies on natural language processing to answer questions like, "Which sales agents are trending up this month?" - delivering instant, visual responses. Craig Roxby, Managing Director at Magnifi, shared:
"Whenever I have a new client meeting, I demonstrate the Ask Zia feature... Its quick, visual responses impress clients."
Zia also generates automated narratives to summarize past performance, predict trends, and identify potential issues. Additional features include predictive analytics with multi-model forecasting, real-time anomaly detection, and what-if analysis to simulate business scenarios. At just $8 per user per month, Zoho Analytics connects to over 500 data sources, supports more than 4 million users, and earns a 91% recommendation rate from surveyed customers.
For a spreadsheet-style approach to KPI tracking, Smartsheet offers a user-friendly solution.
Smartsheet
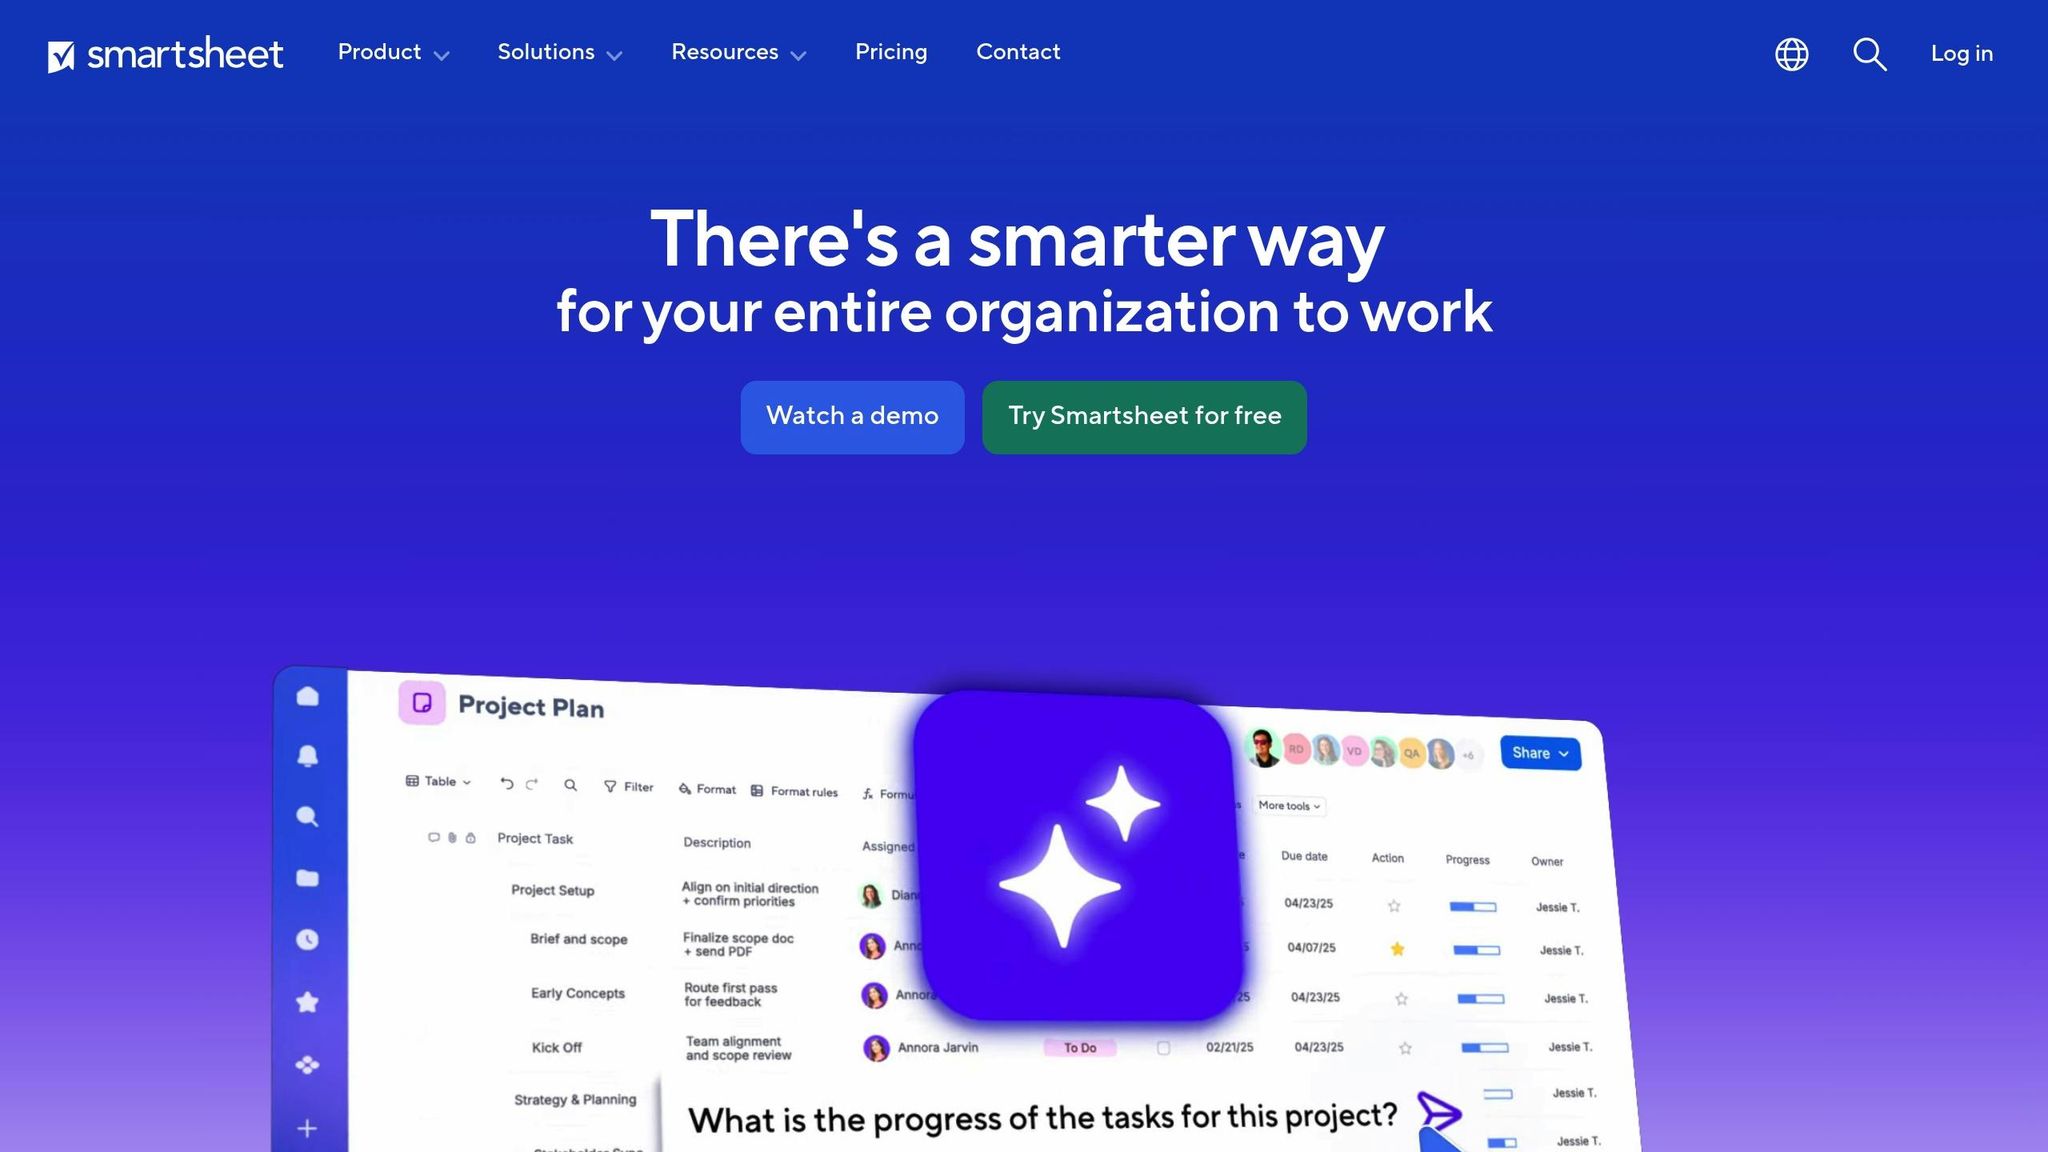
Smartsheet combines a familiar spreadsheet interface with powerful KPI tracking tools, requiring minimal training for teams. Customizable widgets make it easy to tailor dashboards, and the platform integrates with Zoho Analytics to tap into Zia's AI-driven insights. Priced at $12 per user per month, Smartsheet provides a straightforward, practical option for businesses that prefer spreadsheet-based workflows.
For businesses already using Microsoft tools, Power BI offers seamless integration and advanced features.
Power BI
Microsoft's Power BI is designed to work effortlessly within the Microsoft 365 ecosystem. Its Copilot feature leverages generative AI for automated insights and report creation. Users can interact with their data through natural-language queries or voice commands, adding a hands-free element to analysis. The platform also integrates with Power Automate, enabling workflows like sending alerts when revenue falls below a set threshold. At $10 per user per month for the Pro plan, Power BI is an excellent choice for small businesses using tools like Excel, Teams, and Azure.
These tools bring advanced analytics capabilities to small businesses, offering powerful features without the steep learning curve or high costs of enterprise systems.
Comparison Table of KPI Tools
Picking the right KPI tool often comes down to weighing cost, features, and how easy it is to get started. These factors align closely with the need for accessible and effective KPI tools. To simplify your decision-making process, take a look at the comparison below.
Pricing and Features Comparison
| Tool | Starting Price | User Model | Key Integrations | Main Strengths | Main Limitations | Setup Difficulty |
|---|---|---|---|---|---|---|
| Databox | $159/mo (annual) | Unlimited users | 130+ (Google Analytics, HubSpot, Salesforce) | Mobile-friendly design; 200+ templates; free 24-hour expert setup | Advanced features behind paywall; 3–100 data sources depending on plan | Low |
| Klipfolio | $120/mo (annual) | Unlimited users | 500+ connectors, 130+ direct integrations | Excellent multi-source integration; highly customizable; refresh options from 4 hours to real-time | Requires technical knowledge for setup; costs rise with more workspaces | High |
| SimpleKPI | $14/mo | Unlimited on $99/mo tier | 100+ via Zapier | Flat pricing; no per-user fees; setup takes just minutes | Limited data modeling capabilities | Low |
| Geckoboard | $49/mo (annual) | Multiple pricing levels | 90+ (Stripe, Zendesk, Google Sheets) | Optimized for TV displays; pre-built widgets; easy setup | Limited advanced analytics and charting options | Low |
| Zoho Analytics | $30/mo | Per-user | 250+ data connectors | AI assistant (Zia); budget-friendly; customizable branding | Dated interface; basic plans lack robust support | Moderate |
| Power BI | $10/user/mo (Pro) | Per-user | 100+ (Microsoft 365 ecosystem) | Integrates seamlessly with Microsoft tools | Steep learning curve (DAX); struggles with large datasets | High |
If your team already relies on Microsoft 365, Power BI's $10/user/month Pro plan could be a great fit - though its complexity may require some training. For teams looking to avoid per-user fees, SimpleKPI’s $99/month unlimited plan or Klipfolio’s flat-rate structure might be more appealing.
Refresh frequency and data connection limits can also influence your choice. For instance, Klipfolio offers refresh rates from 4 hours to real-time for higher-tier users, while Databox caps connected data sources at 3 to 100 depending on the plan. Most tools include a 14-day free trial, so you can test features and integrations without committing upfront.
This breakdown highlights why choosing the right KPI tool can make a big difference, especially for small businesses aiming to streamline their data tracking.
Why AI for Businesses is a Helpful Resource
Navigating the overwhelming number of KPI tools can be a challenge for small business owners. With 78% of businesses now using AI tools - up from 55% just two years ago - AI for Businesses simplifies this process by offering a curated directory of AI-powered tools. These tools are designed to integrate seamlessly with platforms like Xero, QuickBooks, or HubSpot, making it easier to find solutions that work for your specific needs. This surge in AI adoption highlights the growing demand for reliable resources to guide businesses in choosing the right tools.
The platform organizes tools by business functions such as finance, marketing, sales, and customer support. This categorization helps you quickly pinpoint specialized KPI software tailored to your workflow. Why does this matter? Because 89% of small businesses report improved decision-making when they use KPI software with high-quality visual data tools. This approach not only saves time but also ensures your investment leads to measurable results.
For those looking to maximize efficiency, the Pro plan - priced at $29 per month - provides full access to tools that can save over 20 hours per week. It even helps you calculate ROI by comparing labor costs before and after implementing AI solutions.
A good starting point is to test AI tools in one specific area, like marketing or proactive customer service, before expanding into other functions. With 61% of investors viewing AI adoption as critical to a company’s value, adopting the right tools isn’t just about saving time - it’s about staying competitive in an evolving market.
Conclusion
KPI benchmarking for small businesses is much more than just crunching numbers - it’s about making informed, faster decisions. By comparing your metrics to industry standards, you gain the context to understand what "good" performance truly means. Moving from instinct-based choices to data-driven strategies is what sets growing businesses apart from those that plateau. As Business Analytics Expert Jay Liebowitz aptly states:
An effective KPI is one that prompts decisions, not additional questions.
The tools highlighted here - from Databox with its broad integrations to SimpleKPI’s AI-powered setup - help small businesses streamline tracking and adopt platforms that align with their existing systems. Whether you’re starting with free trials or considering specialized options like Pipedrive for sales tracking, the goal is to select software that integrates smoothly and doesn’t require extensive technical know-how. These solutions simplify the process of finding the right fit.
AI for Businesses further eases this journey by categorizing tools by business function, making it easier to pinpoint options tailored to your workflow. With 89% of small businesses reporting improved decision-making through quality data visualization tools, choosing the right platform isn’t just helpful - it’s critical for staying competitive. This curated directory ensures you’re not bogged down by too many choices and instead guides you toward tools that deliver real results.
Start by focusing on 5–7 key metrics, take advantage of free trials, and evaluate your time savings against labor costs. Pick one tool from this list, test it in a specific area, and then expand its use as you see success.
FAQs
Which KPIs should I track first?
When small businesses begin tracking KPIs, it's smart to start with metrics that provide a snapshot of overall health and progress. Focus on revenue growth rate to monitor financial performance and customer acquisition cost (CAC) to gauge how efficiently you're attracting new customers.
Additionally, keep an eye on website traffic by source and conversion rates. These metrics help you understand which marketing channels are driving visitors and how well those visitors are converting into customers.
Starting with these straightforward KPIs keeps things manageable and directly tied to early growth objectives. They also lay the groundwork for adding more detailed metrics as your business evolves.
How do I benchmark my KPIs against my industry?
To measure your KPIs against industry standards, leverage tools that offer industry-specific insights. For example, platforms like Databox allow you to filter data by factors such as industry, company size, or revenue. They also provide benchmarks for key metrics like revenue and customer acquisition. Additionally, you can create private groups to compare performance with peers. These features make it easier to spot gaps, set achievable goals, and stay aligned with industry norms.
Can these tools pull data from my existing apps automatically?
Many KPI benchmarking tools can directly pull data from the apps and platforms you already use. They achieve this through integrations, APIs, or data connectors, making the process of gathering and analyzing data much simpler. This not only saves time but also ensures your benchmarks are based on the most current data available.